Facebook, the largest social media platform in the world, has 2.4 billion users. Other social media platforms including Youtube and Whatsapp also have more than one billion users each.
These numbers are huge – there are 7.7 billion people in the world, with at least 3.5 billion of us online. This means social media platforms are used by one-in-three people in the world, and more than two-thirds of all internet users.
Social media has changed the world. The rapid and vast adoption of these technologies is changing how we find partners, how we access information from the news, and how we organize to demand political change.
Who uses social media? When did the rise of social media start and what are the largest sites today? Here we answer these and other key questions to understand social media use around the world.
We begin with an outline of key trends and conclude with a perspective on the rate of adoption of social media relative to other modern communication technologies.
The first social media site to reach a million monthly active users was MySpace – it achieved this milestone around 2004. This is arguably the beginning of social media as we know it.1
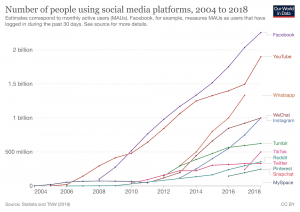
In the interactive chart below we plot monthly active users, by platform, since 2004. You can use the slider to focus on particular years, and you can click the ‘+ Add’ option to change series and track the evolution of other social media platforms.
This chart shows that there are some large social media sites that have been around for ten or more years, such as Facebook, YouTube and Reddit; but other large sites are much newer.
TikTok, for example, launched in September 2016 and by mid-2018 it had already reached half a billion users. To put this in perspective: TikTok gained on average about 20 million new users per month over this period.
The data also shows rapid changes in the opposite direction. Once-dominant platforms have disappeared. In 2008, Hi5, MySpace and Friendster were close competitors to Facebook, yet by 2012 they had virtually no share of the market. The case of MySpace is remarkable considering that in 2006 it temporarily surpassed Google as the most visited website in the US.
Most of the social media platforms that survived the last decade have shifted significantly in what they offer users. Twitter, for example, didn’t allow users to upload videos or images in the beginning. Since 2011 this is possible and today more than 50% of the content viewed on Twitter includes images and videos.

Facebook has dominated the social media market for a decade, but five other platforms also have more than half a billion users each
With 2.3 billion users, Facebook is the most popular social media platform today. YouTube, Instagram and WeChat follow, with more than a billion users. Tumblr and TikTok come next, with over half a billion users.
The bar chart below shows a ranking of the top social media platforms, year by year. You can drag the slider in this chart to see the ranking for other years.
Number of people using social media platforms, 2018
Estimates correspond to monthly active users (MAUs). Facebook, for example, measures MAUs as users that have logged in during the past 30 days. See source for more details.
Some social media sites are particularly popular among specific population groups
The aggregate numbers mask a great deal of heterogeneity across platforms – some social media sites are much more popular than others among specific population groups.
In general, young people are more likely to use social media than older people. But some platforms are much more popular among younger people. This is shown in the chart where we plot the breakdown of social media use by age groups in the US.
 For Snapchat and Instagram the ‘age gradient’ is extremely steep – the popularity of these platforms drops much faster with age. The majority of people under 25 use Snapchat (73%), while only 3% of people over 65 use it.
Since these platforms are relatively new, it’s hard to know how much of this age gradient is the result of a “cohort effect”. In other words: it’s unclear whether today’s young people will continue using Snapchat as they become older. If they do, the age gradient would narrow.
Let’s now look at gender differences.
In this other chart we show the percentage of men and women who use different platforms in the US. The diagonal line marks parity; so sites above the diagonal line are those more popular among men and sites below are those more popular among women. (Bubble sizes are proportional to the total number of users of each platform.)
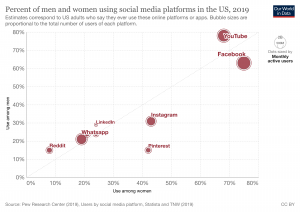
the total number of users of each platform.
For some platforms the gender differences are very large. The share of women who use Pinterest is more than twice as high as the share of men using this platform. For Reddit it is the other way around, the share of men is almost twice as high.
In rich countries almost all young people use social media
From a back-of-the-envelope calculation we know that, if Facebook has 2.3 billion users, then at least 30% of the world uses social media.2 This is of course just an average – for some world regions, and specifically for some population groups, usage rates are much higher.
Young people tend to use social media more frequently. In fact, in rich countries, where access to the internet is nearly universal, the vast majority of young adults use it.
Our chart here shows the proportion of people aged 16 to 24 who use social networks across a selection of countries. As we can see, the average for the OECD is close to 90%.
If today’s young adults continue using social media throughout their life, then it’s likely that social media will continue growing rapidly as internet adoption expands throughout lower-income countries.
Percentage of young people engaging in social networking online, 2014
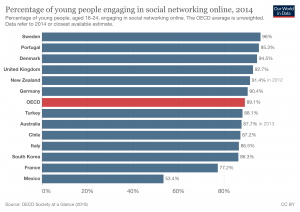
refer to 2014 or closest available estimate.
The rise of social media in rich countries has come together with an increase in the amount of time spent online
The increase in social media use over the last decade has, of course, come together with a large increase in the amount of time that people spend online.
In the US, adults spend more than 6 hours per day on digital media (apps and websites accessed through mobile phones, tablets, computers and other connected devices such as game consoles). As the chart shows, this growth has been driven almost entirely by additional time spent on smartphones and tablets.3
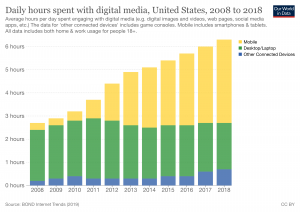
media apps, etc.) The data for ‘other connected devices’ includes game consoles. Mobile includes
smartphones & tablets. All data includes both home & work usage for people 18+.
According to a survey from the Pew Research Center, adults aged 18 to 29 in the US are more likely to get news indirectly via social media than directly from print newspapers or news sites; and they also report being online ‘almost constantly’.4
There is evidence that in other rich countries people also spend many hours per day online. The next chart shows the number of hours young people spend on the internet across a selection of rich countries. As we can see, the average for the OECD is more than 4 hours per day, and in some countries the average is above 6 hours per day.
Daily time spent on the Internet by young people, 2016
Some perspective on how fast and profound these rapid changes are
The percentage of US adults who use social media increased from 5% in 2005 to 79% in 2019. Even on a global stage the speed of diffusion is striking: Facebook surged from covering around 1.5% of the world population in 2008, to around 30% in 2018.5
How does this compare to the diffusion of other communication technologies that make part of our everyday life today?
The following chart provides some perspective.
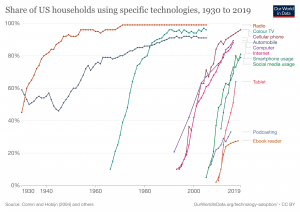
Social media’s growth in the US is comparable – in speed and to some extent also in reach – to that of most modern communication-enabling technologies, including computers, smartphones and the internet.
The rise of social media is an extraordinary example of how quickly and drastically social behaviours can change: Something that is today part of the everyday life of one-third of the world population, was unthinkable less than a generation ago.
Fast changes like those brought about by social media always spark fears about possible negative effects. Specifically in the context of social media, a key question is whether these new communication technologies are having a negative impact on our mental health – this is an important question and we cover the evidence at Our World in Data here.

Feedback/Errata