Explain how objective journalism differs from story-driven journalism.
Describe the effect of objectivity on modern journalism.
Describe the unique nature of literary journalism.
Location, readership, political climate, and competition all contribute to rapid transformations in journalistic models and writing styles. Over time, however, certain styles—such as sensationalism—have faded or become linked with less serious publications, like tabloids, while others have developed to become prevalent in modern-day reporting. This section explores the nuanced differences among the most commonly used models of journalism.
Objective versus Story-Driven Journalism
In the late 1800s, a majority of publishers believed that they would sell more papers by reaching out to specific groups. As such, most major newspapers employed a partisan approach to writing, churning out political stories and using news to sway popular opinion. This all changed in 1896 when a then-failing paper, The New York Times, took a radical new approach to reporting: employing objectivity, or impartiality, to satisfy a wide range of readers.
The Rise of Objective Journalism
At the end of the 19th century, The New York Times found itself competing with the papers of Pulitzer and Hearst. The paper’s publishers discovered that it was nearly impossible to stay afloat without using the sensationalist headlines popularized by its competitors. Although The New York Times publishers raised prices to pay the bills, the higher charge led to declining readership, and soon the paper went bankrupt. Adolph Ochs, owner of the once-failing Chattanooga Times, took a gamble and bought The New York Times in 1896. On August 18 of that year, Ochs made a bold move and announced that the paper would no longer follow the sensationalist style that made Pulitzer and Hearst famous, but instead would be “clean, dignified, trustworthy and impartial (New York Times, 1935).”
This drastic change proved to be a success. TheNew York Times became the first of many papers to demonstrate that the press could be “economically as well as ethically successful (New York Times, 1935).” With the help of managing editor Carr Van Anda, the new motto “All the News That’s Fit to Print,” and lowered prices, The New York Times quickly turned into one of the most profitable impartial papers of all time. Since the newspaper’s successful turnaround, publications around the world have followed The New York Times’ objective journalistic style, demanding that reporters maintain a neutral voice in their writing.
The Inverted Pyramid Style
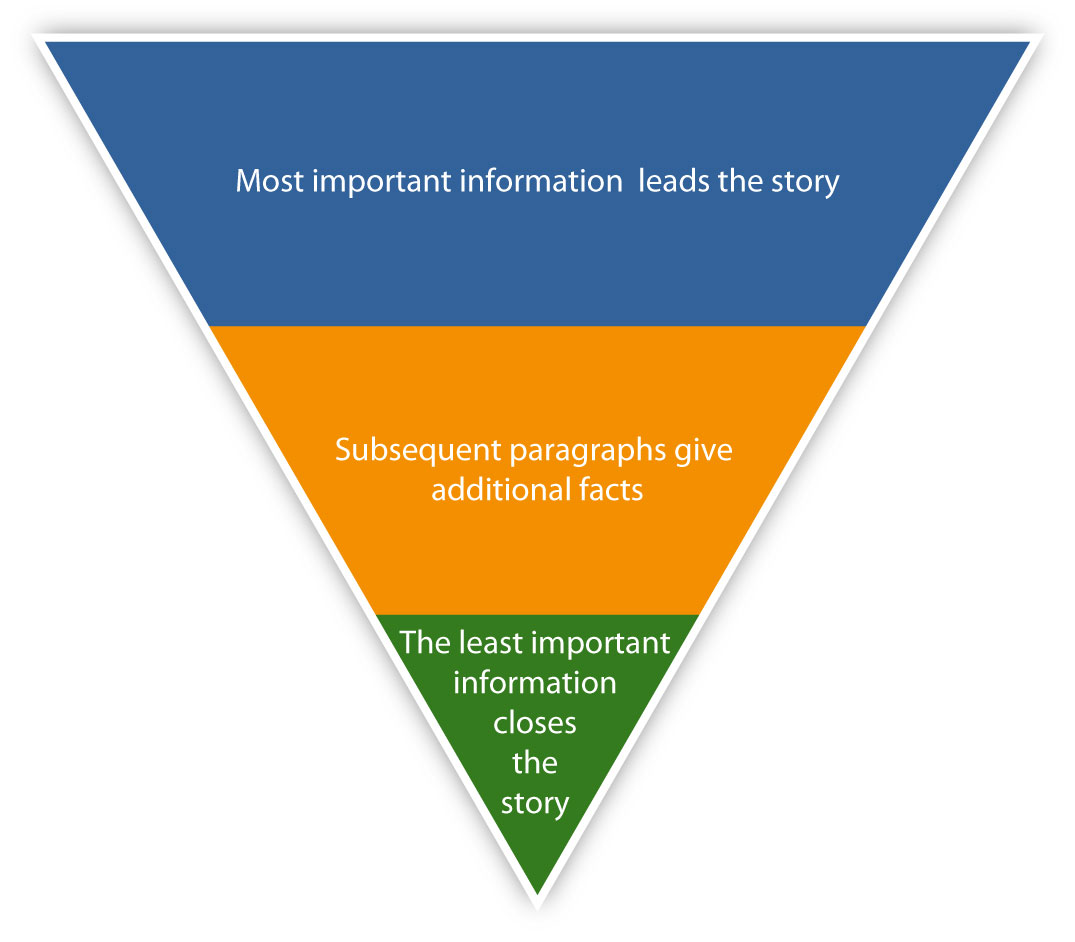
One commonly employed technique in modern journalism is the inverted pyramid style. This style requires objectivity and involves structuring a story so that the most important details are listed first for ease of reading. In the inverted pyramid format, the most fundamental facts of a story—typically the who, what, when, where, and why—appear at the top in the lead paragraph, with nonessential information in subsequent paragraphs. The style arose as a product of the telegraph. The inverted pyramid proved useful when telegraph connections failed in the middle of transmission; the editor still had the most important information at the beginning. Similarly, editors could quickly delete content from the bottom up to meet time and space requirements (Scanlan, 2003).
The reason for such writing is threefold. First, the style is helpful for writers, as this type of reporting is somewhat easier to complete in the short deadlines imposed on journalists, particularly in today’s fast-paced news business. Second, the style benefits editors who can, if necessary, quickly cut the story from the bottom without losing vital information. Finally, the style keeps in mind traditional readers, most of who skim articles or only read a few paragraphs, but they can still learn most of the important information from this quick read.
Figure 4.8
Interpretive Journalism
During the 1920s, objective journalism fell under critique as the world became more complex. Even though The New York Times continued to thrive, readers craved more than dry, objective stories. In 1923, Time magazine launched as the first major publication to step away from simple objectivity to try to provide readers with a more analytical interpretation of the news. As Time grew, people at some other publications took notice, and slowly editors began rethinking how they might reach out to readers in an increasingly interrelated world.
During the 1930s, two major events increased the desire for a new style of journalism: the Great Depression and the Nazi threat to global stability. Readers were no longer content with the who, what, where, when, and why of objective journalism. Instead, they craved analysis and a deeper explanation of the chaos surrounding them. Many papers responded with a new type of reporting that became known as interpretive journalism.
Interpretive journalism, following Time’s example, has grown in popularity since its inception in the 1920s and 1930s, and journalists use it to explain issues and to provide readers with a broader context for the stories that they encounter. According to Brant Houston, the executive director of Investigative Reporters and Editors Inc., an interpretive journalist “goes beyond the basic facts of an event or topic to provide context, analysis, and possible consequences (Houston, 2008).” When this new style was first used, readers responded with great interest to the new editorial perspectives that newspapers were offering on events. But interpretive journalism posed a new problem for editors: the need to separate straight objective news from opinions and analysis. In response, many papers in the 1930s and 1940s “introduced weekend interpretations of the past week’s events…and interpretive columnists with bylines (Ward, 2008).” As explained by Stephen J. A. Ward in his article, “Journalism Ethics,” the goal of these weekend features was to “supplement objective reporting with an informed interpretation of world events (Ward, 2008).”
Competition From Broadcasting
The 1930s also saw the rise of broadcasting as radios became common in most U.S. households and as sound–picture recordings for newsreels became increasingly common. This broadcasting revolution introduced new dimensions to journalism. Scholar Michael Schudson has noted that broadcast news “reflect[ed]…a new journalistic reality. The journalist, no longer merely the relayer of documents and messages, ha[d] become the interpreter of the news (Schudson, 1982).” However, just as radio furthered the interpretive journalistic style, it also created a new problem for print journalism, particularly newspapers.
Suddenly, free news from the radio offered competition to the pay news of newspapers. Scholar Robert W. McChesney has observed that, in the 1930s, “many elements of the newspaper industry opposed commercial broadcasting, often out of fear of losing ad revenues and circulation to the broadcasters (McChesney, 1992).” This fear led to a media war as papers claimed that radio was stealing their print stories. Radio outlets, however, believed they had equal right to news stories. According to Robert W. McChesney, “commercial broadcasters located their industry next to the newspaper industry as an icon of American freedom and culture (McChesney, 1992).” The debate had a major effect on interpretive journalism as radio and newspapers had to make decisions about whether to use an objective or interpretive format to remain competitive with each other.
The emergence of television during the 1950s created even more competition for newspapers. In response, paper publishers increased opinion-based articles, and many added what became known as op-ed pages. An op-ed page—short for opposite the editorial page—features opinion-based columns typically produced by a writer or writers unaffiliated with the paper’s editorial board. As op-ed pages grew, so did interpretive journalism. Distinct from news stories, editors and columnists presented opinions on a regular basis. By the 1960s, the interpretive style of reporting had begun to replace the older descriptive style (Patterson, 2002).
Literary Journalism
Stemming from the development of interpretive journalism, literary journalism began to emerge during the 1960s. This style, made popular by journalists Tom Wolfe (formerly a strictly nonfiction writer) and Truman Capote, is often referred to as new journalism and combines factual reporting with sometimes fictional narration. Literary journalism follows neither the formulaic style of reporting of objective journalism nor the opinion-based analytical style of interpretive journalism. Instead, this art form—as it is often termed—brings voice and character to historical events, focusing on the construction of the scene rather than on the retelling of the facts.
Important Literary Journalists
Figure 4.9
The works of Tom Wolfe are some of the best examples of literary journalism of the 1960s.
Tom Wolfe was the first reporter to write in the literary journalistic style. In 1963, while his newspaper, New York’s Herald Tribune, was on strike, Esquire magazine hired Wolfe to write an article on customized cars. Wolfe gathered the facts but struggled to turn his collected information into a written piece. His managing editor, Byron Dobell, suggested that he type up his notes so that Esquire could hire another writer to complete the article. Wolfe typed up a 49-page document that described his research and what he wanted to include in the story and sent it to Dobell. Dobell was so impressed by this piece that he simply deleted the “Dear Byron” at the top of the letter and published the rest of Wolfe’s letter in its entirety under the headline “There Goes (Varoom! Varoom!) That Kandy-Kolored Tangerine-Flake Streamline Baby.” The article was a great success, and Wolfe, in time, became known as the father of new journalism. When he later returned to work at the Herald Tribune, Wolfe brought with him this new style, “fusing the stylistic features of fiction and the reportorial obligations of journalism (Kallan, 1992).”
Truman Capote responded to Wolfe’s new style by writing In Cold Blood, which Capote termed a “nonfiction novel,” in 1966 (Plimpton, 1966). The tale of an actual murder that had taken place on a Kansas farm some years earlier, the novel was based on numerous interviews and painstaking research. Capote claimed that he wrote the book because he wanted to exchange his “self-creative world…for the everyday objective world we all inhabit (Plimpton, 1966).” The book was praised for its straightforward, journalistic style. New York Times writer George Plimpton claimed that the book “is remarkable for its objectivity—nowhere, despite his involvement, does the author intrude (Plimpton, 1966).” After In Cold Blood was finished, Capote criticized Wolfe’s style in an interview, commenting that Wolfe “[has] nothing to do with creative journalism,” by claiming that Wolfe did not have the appropriate fiction-writing expertise (Plimpton, 1966). Despite the tension between these two writers, today they are remembered for giving rise to a similar style in varying genres.
The Effects of Literary Journalism
Although literary journalism certainly affected newspaper reporting styles, it had a much greater impact on the magazine industry. Because they were bound by fewer restrictions on length and deadlines, magazines were more likely to publish this new writing style than were newspapers. Indeed, during the 1960s and 1970s, authors simulating the styles of both Wolfe and Capote flooded magazines such as Esquire and The New Yorker with articles.
Literary journalism also significantly influenced objective journalism. Many literary journalists believed that objectivity limited their ability to critique a story or a writer. Some claimed that objectivity in writing is impossible, as all journalists are somehow swayed by their own personal histories. Still others, including Wolfe, argued that objective journalism conveyed a “limited conception of the ‘facts,’” which “often effected an inaccurate, incomplete story that precluded readers from exercising informed judgment (Kallan).”
Advocacy Journalism and Precision Journalism
The reactions of literary journalists to objective journalism encouraged the growth of two more types of journalism: advocacy journalism and precision journalism. Advocacy journalists promote a particular cause and intentionally adopt a biased, nonobjective viewpoint to do so effectively. However, serious advocate journalists adhere to strict guidelines, as “an advocate journalist is not the same as being an activist” according to journalist Sue Careless (Careless, 2000). In an article discussing advocacy journalism, Careless contrasted the role of an advocate journalist with the role of an activist. She encourages future advocate journalists by saying the following:
A journalist writing for the advocacy press should practice the same skills as any journalist. You don’t fabricate or falsify. If you do you will destroy the credibility of both yourself as a working journalist and the cause you care so much about. News should never be propaganda. You don’t fudge or suppress vital facts or present half-truths (Careless, 2000).
Despite the challenges and potential pitfalls inherent to advocacy journalism, this type of journalism has increased in popularity over the past several years. In 2007, USA Today reporter Peter Johnson stated, “Increasingly, journalists and talk-show hosts want to ‘own’ a niche issue or problem, find ways to solve it, and be associated with making this world a better place (Johnson, 2007).” In this manner, journalists across the world are employing the advocacy style to highlight issues they care about.
Oprah Winfrey: Advocacy Journalist
Television talk-show host and owner of production company Harpo Inc., Oprah Winfrey is one of the most successful, recognizable entrepreneurs of the late-20th and early-21st centuries. Winfrey has long been a news reporter, beginning in the late 1970s as a coanchor of an evening television program. She began hosting her own show in 1984, and in 2010, the Oprah Winfrey Show was one of the most popular TV programs on the air. Winfrey had long used her show as a platform for issues and concerns, making her one of the most famous advocacy journalists. While many praise Winfrey for using her celebrity to draw attention to causes she cares about, others criticize her techniques, claiming that she uses the advocacy style for self-promotion. As one critic writes, “I’m not sure how Oprah’s endless self-promotion of how she spent millions on a school in South Africa suddenly makes her ‘own’ the ‘education niche.’ She does own the trumpet-my-own-horn niche. But that’s not ‘journalism (Schlussel, 2007).’”
Yet despite this somewhat harsh critique, many view Winfrey as the leading example of positive advocacy journalism. Sara Grumbles claims in her blog “Breaking and Fitting the Mold”: “Oprah Winfrey obviously practices advocacy journalism…. Winfrey does not fit the mold of a ‘typical’ journalist by today’s standards. She has an agenda and she voices her opinions. She ha[d] her own op-ed page in the form of a million dollar television studio. Objectivity is not her strong point. Still, in my opinion she is a journalist (Grumbles, 2007).”
Regardless of the arguments about the value and reasoning underlying her technique, Winfrey unquestionably practices a form of advocacy journalism. In fact, thanks to her vast popularity, she may be the most compelling example of an advocacy journalist working today.
Precision journalism emerged in the 1970s. In this form, journalists turn to polls and studies to strengthen the accuracy of their articles. Philip Meyer, commonly acknowledged as the father of precision journalism, says that his intent is to “encourage my colleagues in journalism to apply the principles of scientific method to their tasks of gathering and presenting the news (Meyer, 2002).” This type of journalism adds a new layer to objectivity in reporting, as articles no longer need to rely solely on anecdotal evidence; journalists can employ hard facts and figures to support their assertions. An example of precision journalism would be an article on voting patterns in a presidential election that cites data from exit polls. Precision journalism has become more popular as computers have become more prevalent. Many journalists currently use this type of writing.
Consensus versus Conflict Newspapers
Another important distinction within the field of journalism must be made between consensus journalism and conflict journalism. Consensus journalism typically takes place in smaller communities, where local newspapers generally serve as a forum for many different voices. Newspapers that use consensus-style journalism provide community calendars and meeting notices and run articles on local schools, events, government, property crimes, and zoning. These newspapers can help build civic awareness and a sense of shared experience and responsibility among readers in a community. Often, business or political leaders in the community own consensus papers.
Conversely, conflict journalism, like that which is presented in national and international news articles in The New York Times, typically occurs in national or metropolitan dailies. Conflict journalists define news in terms of societal discord, covering events and issues that contravene perceived social norms. In this style of journalism, reporters act as watchdogs who monitor the government and its activities. Conflict journalists often present both sides of a story and pit ideas against one another to generate conflict and, therefore, attract a larger readership. Both conflict and consensus papers are widespread. However, because they serve different purposes and reach out to differing audiences, they largely do not compete with each other.
Niche Newspapers
Niche newspapers represent one more model of newspapers. These publications, which reach out to a specific target group, are rising in popularity in the era of Internet. As Robert Courtemanche, a certified journalism educator, writes, “In the past, newspapers tried to be everything to every reader to gain circulation. That outdated concept does not work on the Internet where readers expect expert, niche content (Courtemanche, 2008).” Ethnic and minority papers are some of the most common forms of niche newspapers. In the United States—particularly in large cities such as New York—niche papers for numerous ethnic communities flourish. Some common types of U.S. niche papers are papers that cater to a specific ethnic or cultural group or to a group that speaks a particular language. Papers that cover issues affecting lesbians, gay men, and bisexual individuals—like the Advocate—and religion-oriented publications—like The Christian Science Monitor—are also niche papers.
The Underground Press
Some niche papers are part of the underground press. Popularized in the 1960s and 1970s as individuals sought to publish articles documenting their perception of social tensions and inequalities, the underground press typically caters to alternative and countercultural groups. Most of these papers are published on small budgets. Perhaps the most famous underground paper is New York’s Pulitzer Prize–winning Village Voice. This newspaper was founded in 1955 and declares its role in the publishing industry by saying:
The Village Voice introduced free-form, high-spirited and passionate journalism into the public discourse. As the nation’s first and largest alternative newsweekly, the Voice maintains the same tradition of no-holds-barred reporting and criticism it first embraced when it began publishing fifty years ago (Village Voice).
Despite their at-times shoestring budgets, underground papers serve an important role in the media. By offering an alternative perspective to stories and by reaching out to niche groups through their writing, underground-press newspapers fill a unique need within the larger media marketplace. As journalism has evolved over the years, newspapers have adapted to serve the changing demands of readers.
To gain a clearer picture of how locally focused U.S. newspapers have fared in the digital age, Pew Research Center researchers reexamined data included in the Center’s State of the News Media newspapers fact sheet, excluding four publications that reach a large national audience. (Three of these four newspapers reach national audiences in addition to their respective local audiences.) These four publications – The New York Times, The Washington Post, The Wall Street Journal and USA Today – account for a large share of circulation in the newspaper industry and as such overshadow their locally focused counterparts in the data. Specifically, this analysis looks at economic data from publicly traded newspaper companies’ financial statements (2011-2020 for digital advertising revenue and 2013-2020 for total revenues), circulation data from Alliance for Audited Media (2015-2020), and digital audience data from Comscore (2014-2020). This addendum supplements the State of the News Media newspapers fact sheet, which presents the analysis at the overall industry level.
This locally focused analysis shows that many of the trends apparent in the overall newspaper industry hold true for local U.S. newspapers as well.
Audience
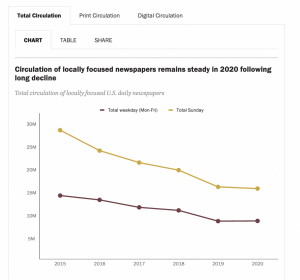
The total combined print and digital circulation for locally focused U.S. daily newspapers in 2020 was 8.3 million for weekday (Monday-Friday) and 15.4 million for Sunday. Each of these numbers is roughly on par with the previous year, but they are still among the lowest reported: Total weekday circulation is down 40% since 2015, the first year available for this analysis. Similarly, total Sunday circulation has fallen 45% since 2015.
This graph from the Pew Research Center shows the declining circulation of newspapers from 2014 to 2020.This graph from the Pew Research Center shows the decline of circulation in print newspapers from 2014 to 2020.This Pew Research Center graph shows the rise in digital circulation since 2016.
Note: Total circulation includes print and digital circulation. Figures are taken from an analysis of more than 200 newspapers for weekday circulation and more than 400 papers for Sunday circulation. Figures do not include the following publications with a national audience: The New York Times, The Washington Post, The Wall Street Journal and USA Today. Figures are not adjusted according to pre-2015 data from Editor & Publisher and are thus not comparable to the estimated figures published in Pew Research Center’s State of the News Media newspapers fact sheet. Affiliated publications are not included in the analysis. Weekday circulation only includes those publications reporting a Monday-Friday average. Data reflects either three-month averages (2015-2019) or the six-month period ending Sept. 30 (2020).
Source: Pew Research Center analysis of Alliance for Audited Media data.
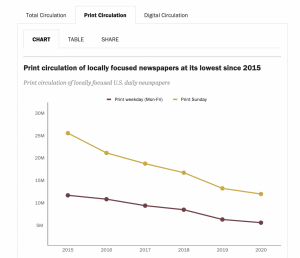
Within those overall declines is a more complex relationship between print and digital circulation. Print weekday circulation in 2020 was down 12% from 2019, while print Sunday circulation declined 10%.
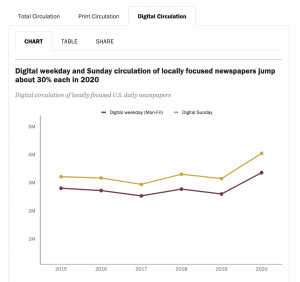
In contrast, digital weekday circulation was up 30% in 2020, and digital Sunday circulation climbed 29%. The 2020 increases for digital circulation are the greatest year-over-year increases for digital since 2015. Overall, digital weekday circulation has grown 21% since 2015, and digital Sunday circulation has increased 27%.
Print, meanwhile, experienced a steady decline in both weekday and Sunday circulation between 2015 and 2020, falling 55% for print weekday during this time and 54% for print Sunday.
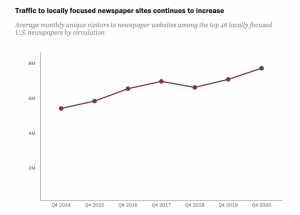
To get a clearer picture of the digital audience for locally focused publications, researchers reexamined the Comscore data included in the State of the News Media newspapers fact sheet by removing newspapers with a national audience from the analysis (The New York Times, The Washington Post, The Wall Street Journal and USA Today). This updated analysis of locally focused daily U.S. newspapers includes the remaining top 46 publications based on their circulation.1
Graph of the increase of traffic to local news websites from the Pew Research Center.
Note: For each year, the average traffic for each website during the fourth quarter (October-December) was calculated; the data point represents the overall average of those numbers. Analysis is of the top 46 newspapers by average Sunday circulation for Q3 2015-2020, according to Alliance for Audited Media data, excluding The New York Times, The Washington Post, The Wall Street Journal and USA Today, which have a large national audience. For each newspaper, the Comscore entity matching its homepage URL was analyzed.
Source: Comscore Media Metrix® Multi-Platform, U.S., Unique Visitors, October-December 2014-2020.
In the fourth quarter of 2020, there were an average of 7.6 million monthly unique visitors to these 46 local news sites, up 9% from 2019. (When the four national publications above are included, newspapers received 13.9 million unique online visitors in the fourth quarter of 2020, up 14% from 2019.)
The average number of monthly unique visitors to local news websites has increased 44% since the fourth quarter of 2014, the first year in our data.
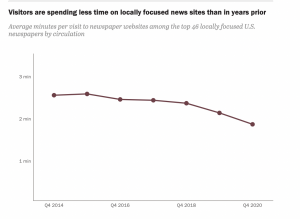
The increase in the number of visitors to locally focused news sites has been accompanied by a simultaneous decline in the duration of those visits – a pattern that exists for the newspaper industry overall. In the fourth quarter of 2020, the average minutes per visit to the websites of local papers was 1.8 minutes, compared with 2.1 minutes in Q4 2019. This is a 13% year-over-year decline, the steepest drop in minutes per visit since Q4 2014, the first year in our data.
Pew Research Center graph of visitor time spent on news sites, which is on the decline.
Note: For each year, the average minutes per visit for each website during the fourth quarter (October-December) was calculated; the data point represents the overall average of those numbers. Analysis is of the top 46 newspapers by average Sunday circulation for Q3 2015-2020, according to Alliance for Audited Media data, excluding The New York Times, The Washington Post, The Wall Street Journal and USA Today, which have a large national audience. For each newspaper, the Comscore entity matching its homepage URL was analyzed.
Source: Comscore Media Metrix® Multi-Platform, U.S., Average Minutes Per Visit, October-December 2014-2020.
Overall, the average duration of visits to local news websites has declined 41 seconds since Q4 2014, similar to the overall decrease of 45 seconds in the broader industry.
Revenue
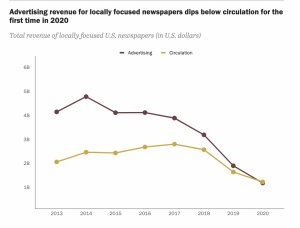
The total advertising revenue for locally focused U.S. daily newspapers in 2020 was $1.07 billion, based on the Center’s analysis of financial statements for publicly traded newspaper companies.2 This is down 40% from 2019, much steeper than the 25% decline the overall newspaper industry experienced during the same time. Total circulation revenue was $1.1 billion in 2020 for local newspapers, compared with $1.5 billion in 2019. As is also seen in the overall industry, 2020 was the first year local newspaper advertising revenue fell below circulation revenue.
(Note: USA Today is included in the revenue data)
Advertising revenue for locally focused newspapers dips below circulation for the first time in 2020.
Note: Data shows the dollar amount of each revenue type according to analysis of year-end SEC filings. Figures do not include The New York Times, The Washington Post or The Wall Street Journal, which have a large national audience. USA Today is included as part of Gannett’s overall revenues. Dollar values are not adjusted according to pre-2013 data from News Media Alliance and thus are not comparable to the estimated figures published in Pew Research Center’s State of the News Media newspapers fact sheet.
Source: Pew Research Center analysis of year-end Securities and Exchange Commission filings of publicly traded newspaper companies (2013-2020).
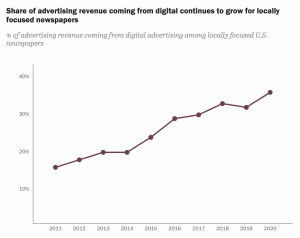
Digital advertising accounted for 35% of advertising revenue for locally focused U.S. newspapers in 2020, based on this analysis of publicly traded newspaper companies. That share is roughly on par with the 39% of ad revenue coming from digital ads in the overall industry. For local newspapers, the share of ad revenue coming from digital has grown steadily from 15% in 2011, the first year in our data.
Share of advertising revenue coming from digital continues to grow for locally focused newspapers
Note: Figures do not include The New York Times, The Washington Post or The Wall Street Journal, which have a large national audience. USA Today is included as part of Gannett’s overall revenues.
Source: Pew Research Center analysis of year-end Securities and Exchange Commission filings for publicly traded newspaper companies that break out digital advertising revenue for each year (2011-2020).
Researchers examined digital traffic of the top 46 locally focused daily U.S. newspapers with the highest circulation according to Alliance for Audited Media data. Many daily newspapers do not receive enough traffic to their websites to be measured by Comscore, and for this reason, this analysis is based on the top 46 locally focused daily U.S. newspapers.
Only revenue figures from The New York Times have been removed from this analysis. Gannett does not report its revenues by individual news brands in its SEC filings, so USA Today could not be excluded from this revenue data. The Washington Post and The Wall Street Journal are not publicly traded and are therefore not part of the revenue analysis here or in the Center’s State of the News Media newspapers fact sheet.
Key Takeaways
Objective journalism began as a response to sensationalism and has continued in some form to this day. However, some media observers have argued that it is nearly impossible to remain entirely objective while reporting a story. One argument against objectivity is that journalists are human and are, therefore, biased to some degree. Many newspapers that promote objectivity put in place systems to help their journalists remain as objective as possible.
Literary journalism combines the research and reporting of typical newspaper journalism with the writing style of fiction. While most newspaper journalists focus on facts, literary journalists tend to focus on the scene by evoking voices and characters inhabiting historical events. Famous early literary journalists include Tom Wolfe and Truman Capote.
Other journalistic styles allow reporters and publications to narrow their editorial voice. Advocacy journalists encourage readers to support a particular cause. Consensus journalism encourages social and economic harmony, while conflict journalists present information in a way that focuses on views outside of the social norm.
Niche newspapers—such as members of the underground press and those serving specific ethnic groups, racial groups, or speakers of a specific language—serve as important media outlets for distinct voices. The rise of the Internet and online journalism has brought niche newspapers more into the mainstream.
Exercises
Please respond to the following writing prompts. Each response should be a minimum of one paragraph.
Find an objective newspaper article that includes several factual details. Rewrite the story in a literary journalistic style. How does the story differ from one genre to the other?
Was it difficult to transform an objective story into a piece of literary journalism? Explain.
Do you prefer reading an objective journalism piece or a literary journalism piece? Explain.
Kallan, Richard K. “Tom Wolfe,” in A Sourcebook of American Literary Journalism: Representative Writers in an Emerging Genre, ed. Thomas B. Connery (Santa Barbara: Greenwood Press, 1992).
McChesney, Robert W. “Media and Democracy: The Emergence of Commercial Broadcasting in the United States, 1927–1935,” in “Communication in History: The Key to Understanding” OAH Magazine of History 6, no. 4 (1992): 37.
Meyer, Phillip. Precision Journalism: A Reporter’s Introduction to Social Science Methods, 4th ed. (Oxford: Rowman & Littlefield Publishers, 2002), vii.
Schudson, Michael. “The Politics of Narrative Form: The Emergence of News Conventions in Print and Television,” in “Print Culture and Video Culture,” Daedalus 111, no. 4 (1982): 104.
Ward, Stephen J. A. “Journalism Ethics,” in The Handbook of Journalism Studies, ed. Karin Wahl-Jorgensen and Thomas Hanitzsch (New York: Routledge, 2008): 298.


Feedback/Errata