Community Structure
Community Structure
Purpose and Objectives:
- Use the quadrat method for studying communities.
- Determine the density, relative density, frequency and relative frequency of each species in a community.
- Determine which species of plants are dominant in a community and why.
- Determine if plants have a clumped, random or uniform distribution.
Introduction:
A community consists of all the different species of organisms (plants, animal and microorganisms) that occur in the same location and interact with one another in specific ways. Organisms of the same species that live in the same place make up a population. Thus, a community consists of an assemblage of populations existing in a common area that interact with each other and share the same general resources. An ecosystem is a broader concept than a community because in addition to the organisms (biotic components) it includes abiotic or physical components. Abiotic components of the environment, such as precipitation, temperature, and soil help define the nature of the community. Some communities, such as artic tundra, are simple, with only a few hundred species interacting. Others, like tropical rainforests, contain many thousands of species, which produce a complex web of interactions.
A complete study of community structure would include identifying all the organisms present and describing how they interact with one another. Because community are incredibly diverse in structure and function, it is impractical to study every organism in a community. However, we can gain insight into the structure and function of a community by studying samples of a community.
In a community, it is usually easier to study the plants than animals or microbes, since plants don’t move and are generally large enough to be identified easily. Although this lab is designed to survey plants in a grassland, the exercise can be adapted to other kinds of communities (forests, deserts, or wetlands) by slightly changing the way species are counted.
Another aspect of community structure is the degree to which certain species are dominant members of the community. There are several ways to gain and idea of the dominance of a species. Two measures of dominance known as relative density and relative frequency compare numbers of organisms. However, these methods do not consider the size of an organisms. One large maple tree would have a larger influence on a community than one dandelion. Therefore, some way of evaluating size is important in determining dominance.
In this lab, we will use determinations of the relative density, relative frequency, and the size of plants to evaluate the degree in which certain species are dominant in their community.
Materials:
- 50-meter tape
- Several hula hoops
- Marking flags
- Notebook
- Data Sheets
Procedure:
- Your instructor will assign students to groups. Each group will count the plants in two quadrats in the field and share their data with the rest of the class.
- Images of the plant species can be found on Data Sheet 1.6.
- In the field, establish a 100 square meter study area by using the 50-meter tape.
- Quadrats within the 100 square meter study area will be randomly established using hula hoops provided to each group.
- Instructor will demonstrate how to randomly establish the hula hoop.
- For the first quadrat, identify, count, and record the number of plants belonging to each of the six species on Table 1.1.
- While counting, you much make several decisions. To include a plant in the count, at least 50 percent of it must be in the quadrat. For bushes or grasses, you must decide as a to what is an individual plant, since one plant may be look like several plants. Ask your instructor for help if needed.
- On Figure 1.1 record the species, size and location of each plant in quadrat 1. Indicate the plant’s size by drawing a circle proportional to the size of the plant in the quadrat. Identify the species by the first letter of the plant name. What you will end up with is a vegetation “map” of the quadrat, showing the relative size and number of the six species.
- For the second quadrat, repeat the procedures and record the results on Table 1.2 and Figure 1.2
- Share your data with the class and complete Table 1.3 with all the data from the other groups.
- Complete the calculations for relative density and relative frequency on Data Sheets 1.3 and 1.4
Data Sheet 1.1
Table 1.1 Plants Identified in First Quadrat
| Species | # of Plants in Quadrat
|
| Yucca | |
| Mullen |
|
| Smooth Broom | |
| Thistle | |
| Cactus | |
| Rabbit Brush |
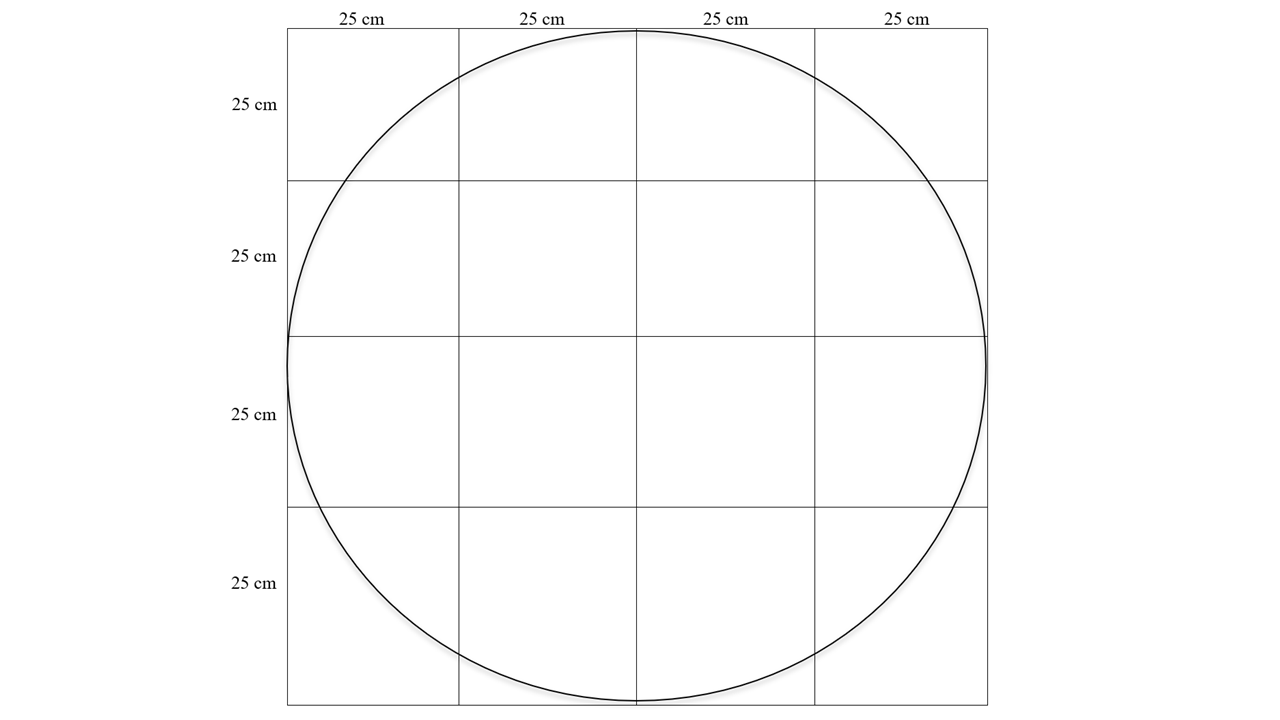
Figure 1.1 Vegetation Map for Quadrat 1
Use the first letter of each plant species as an identifier to mark the approximate location of each plant on the map below. Draw a circle around each letter to represent the relative size of each plant. The circle represents the hula-hoop you used to create your Quadrat.
Data Sheet 1.2
Table 1.2 Plants Identified in Second Quadrat
| Species | # of Plants in Quadrat
|
| Yucca | |
| Mullen |
|
| Smooth Broom | |
| Thistle | |
| Cactus | |
| Rabbit Brush |
Figure 1.1 Vegetation Map for Quadrat 2
Use the first letter of each plant species as an identifier to mark the approximate location of each plant on the map below. Draw a circle around each letter to represent the relative size of each plant. The circle represents the hula-hoop you used to create your Quadrat.
Data Sheet 1.3
Table 1.3 Class Results
| Number of Each Species in Each Quadrat | |||||||||||||
| Quadrat Number | 1 | 2 | 3 | 4 | 5 | 6 | 7 | 8 | 9 | 10 | 11 | 12 | Total |
| Yucca | |||||||||||||
| Mullen |
|
||||||||||||
| Smooth Broom | |||||||||||||
| Thistle | |||||||||||||
| Cactus | |||||||||||||
| Rabbit Brush | |||||||||||||
| Total |
Relative Density Calculation
- To determine the species density of each of six species:
- In column 1 of Table 1.4, enter the total number of each species counted from the far-right column of Table 1.3.
- In column 2, enter the total area sampled. (The total area sampled will be the size of the Quadrat times the number of Quadrats sampled by the class.)
- Dived column 1 by column 2 and record in column 3.
- Repeat for all species.
- To determine the total density of plants:
- Add the total of all plants of all six species in all Quadrats in Table 1.3.
- Divide the total number of plants by the total area sampled.
- Record this number for all of column 4.
- To determine the relative density of each of the six plants:
- Divide column 3 by column 4 and multiply by 100.
- Record results in column 5.
Table 1.4 Relative Density
| Species | Column 1
Total Number of Plants |
Column 2
Total Area Sampled (m2) |
Column 3
Species Density (Plants/m2) |
Column 4
Total Density (ALL Plants/m2) |
Column 5
Relative Density
|
| Yucca | |||||
| Mullen |
|
||||
| Smooth Broom | |||||
| Thistle | |||||
| Cactus | |||||
| Rabbit Brush |
Data Sheet 1.4
Relative Frequency Calculation
- To determine the frequency of each of the six plants:
- In column 1 in Table 1.5, record the number of Quadrats that contained the particular species from Table 1.3.
- In column 2, record the total number or Quadrats surveyed by the class.
- Dived column 1 by column 2 to get the frequency of each species.
- Record in column 3.
- To determine the total frequency for all Quadrats sampled:
- Use the data in Table 1.3 to determine the number of Quadrats that had any of the six plants.
- Divide the number of Quadrats that had any of the six plants by the total number of Quadrats sampled.
- Record this number for all of column 4.
- To determine the relative frequency of each plant species:
- Divide column 3 by column 4 and multiply by 100.
- Record results in column 5.
Table 1.5 Relative Frequency
| Species | Column 1
Number of Quadrats in Which species Occurs |
Column 2
Total Number of Quadrats |
Column 3
Frequency of Species |
Column 4
Total Frequency
|
Column 5
Relative Frequency
|
| Yucca | |||||
| Mullen |
|
||||
| Smooth Broom | |||||
| Thistle | |||||
| Cactus | |||||
| Rabbit Brush |
Data Sheet 1.5
Analysis
- A simple count of the number of plants present does not consider the size of individual plants. Some plants may be very numerous but occupy much space. In other cases, a single plant may occupy a larger space. The vegetation maps you created allow you to examine the impact of plants of different sizes.
- According to the vegetation maps you created, which species of plant appeared to be the most dominant?
2. Approximately what percent of the area of each Quadrat was taken up by the most dominant plant?
3. Did both Quadrats sampled show the same dominant species?
4. Compare your vegetation maps with other groups in the class. Did they have similar results? Why might they be different?
5. Based on the relative density of each species, which plant is the most dominant?
-
- Is this the same plant you identified as dominant in question 1?
- If they are different, what would account for the difference?
6. Based on the relative frequency of each species, which plant occurs most frequently?
-
- Is this the same species that was the most dominate based on the vegetation maps and relative density data?
- Explain any differences.
7. Use the relative frequency of each species (Table 1.5) to determine if the distribution of each species is clumped, random, or uniform. Record the distribution type for each species in the table below. Clumped species typically have a relative frequency between 0 and 30; randomly distributed species typically have a relative frequency between 31 and 80; and uniformly distributed species typically have a relative frequency between 80 and 100.
| Species | Relative Frequency | Distribution Type |
| Yucca | ||
| Mullen | ||
| Smooth Broom | ||
| Thistle | ||
| Cactus | ||
| Rabbit Brush |
8. List three characteristics of plants that might contribute to the clumped distribution type.
9. What environmental characteristics might contribute to a uniform distribution type.
10. Are there any environmental features or characteristics (e.g., slope, soil moisture, shade, etc.) that might lead to the distribution types you observed for each species?
11. What is the relationship between density and frequency? Can a species of a plant have a high relative density and a low relative frequency, or vice versa? Explain.
12. What difficulties may you encounter running a similar Quadrat study on animal populations or in an aquatic environment?