Studying Soil Characteristics and Utilization
Studying Soil Characteristics and Utilization
Purpose and Objectives:
- To gain experience in recognizing the various soil layers in the field.
- To be able to observe a close-up soil sample & deduce what type of soil it is.
- To record the soil chemistry & make connections on its best utilitarian uses.
Introduction:
Soil can be technically defined as a mixture of water, gases, organic matter, and weathered mineral matter that can sustain vegetative growth (roots). Concerning the weathered mineral matter bit, the mineral composition is a direct reflection of the regional bedrock. The soil composition is influenced not only by the local bedrock (parent material) but also transported (eroded) material from other faraway soils. Four important chemical indicators typically tested in soil are pH, nitrates, phosphates, and potash (potassium content) and are used to determine a soil’s growing capacity. The regional climate is another important influence on soil makeup. With some exceptions, the warmer the climate, the faster the rate of weathering. The more moisture in an area, either with flowing liquid water or water vapor (humidity), the faster the rate of weathering.
On average, it takes around 10,000 years (give or take) to grow one new inch of topsoil. Compared to the average human lifespan, it can be argued that soil is classified as a nonrenewable resource. Thus, the conservation of soil is a very important topic of concern, especially in rural areas. For example, the specific mineral nutrients in the soil strongly govern what crops grow. Crops can have varying values for farmers and consumers. If said crops cannot be grown as much if the soil content is compromised, the livelihood of entire communities and regions can drastically change. Since soil particles are typically very fine, soil erosion can occur quite easily (i.e., from weather events, construction and other land-altering activities).
In addition, soil is divided into various layers or horizons characterized by the dominant material involved. On average, there are five soil horizons (from top to getting deeper underground): O, A, E, B and C. The O layer is dominantly dark organic matter (hence, O for organic!). The A layer is also composed of organic matter, as well as live organic activity (i.e., burrowing crickets & worms). The O & A layers combined is colloquially known as topsoil. The E layer is where dominantly mineral matter used to reside but has been dissolved and leached (hence, the zone of leaching). Said leached mineral matter is transported downward and precipitated in the B layer (the zone of accumulation). Hence, this layer is typically rich in solid minerals, such as clay, that makes this layer rather dense. The C layer is native (parent) bedrock material that is starting to undergo weathering. Over time, the thickness of solid bedrock material will decrease and the thickness of soil increases. The five soil horizons can vary greatly in terms of thickness and specific composition even over short distances. In some environments, a soil layer can be totally absent. One example is in deserts where the ground is typically sandy or rocky and not composed of dark organic matter. Thus, when you explore a desert, you can walk directly on the E layer as opposed to the O layer.
Soil scientists study very specific details of soil composition. In cases like this, a valuable tool is often utilized called a Munsel Book. Since it is difficult to study the fineness and relative lack of texture of soils, the Munsel Book offers a universal code system (hue, value & chroma) to describe namely the color. This allows for easy comparison of soil across different physical areas and academic disciplines. One of the most important details that soil color can elucidate is the degree of oxidation of iron content. Reddish soil indicate higher degrees of oxidation, whereas blue-gray hues indicate more reducing (oxygen-poor) conditions.
In this lab, you will gain experience in analyzing two different soil samples you’ll take around your campus (or backyard). After collecting data on soil chemistry, water retention, texture and color, the most ideal uses of the soils – and hence, the best uses for the land – will be established.
Materials:
- Shovel or soil auger
- Spray bottle with water
- Funnel
- Soil digital analyzer
- Munsel book
- Tape measure or meter stick
- Level
Hypothesis:
Compose a hypothesis connecting the color of a soil (dark gray-brown/black, yellow-brown, and pale brown to red) to the amount of organic matter it contains and what that means for the soil’s fertility. In other words, make a three-way connection or relationship (color to organic matter to fertility) for each of the three color categories listed above. Record your hypotheses in your lab report.
Procedure:
- Select a site around your campus or neighborhood that represents a good average slope of the area.
- Take a meter stick & hold it flat on the ground, with one end pointing downslope. Use the level to ensure the meter stick is level (when the bubble is in the middle).
- Use the centimeter (metric) end of the ruler and measure the gap between the ground & the suspended end of the meter stick. Record the number of centimeters in the gap in the appropriate data table. This will be the slope of the land in percent.
- Now to take your soil sample! Use a shovel or soil auger and take as deep of a sample as you can (1-2 feet). Use the rule to measure the thickness of each distinct layer. Using Figure 2, sketch and label each soil horizon with their corresponding depths. Use Figure 1 if you need assistance in identifying the soil horizons.
- Take a sample of each soil horizon and record the following in Data Table 1:
- Color, Hue, Value & Chroma – record the visual color of your samples using your own descriptions. Then, take the samples and match them in the Munsel Book to the best you can. Once you make a visual color match, record the hue, value and chroma from the book.
- Texture – feel the sample in between your fingers. If it feels like it has grit (like sandpaper), it is sand. If it feels smooth, slick and not sticky, it is silt. If it’s smooth and sticky when moistened, it is clay.
- Water Retention – put the same, one layer at a time, in the funnel. Use the spray bottle to spray several spurts of water into the funnel. Watch how fast the water moves through the sample. If the water moves fast, the sample is sand. If it moves slower, it is silt. If water moves extremely slowly, it is clay.
- Using the same samples, use the soil digital analyzer and record the following in Data Table 2:
- pH
- Nitrate
- Phosphate
- Potash (Potassium content)
| Slope | Color Description | Hue, Value, Chroma | Sediment Size (Texture) | Water Retention | |
| Layer 1 | |||||
| Layer 2 | |||||
| Layer 3 |
Data Table #1: Soil Physical Characteristics Data
| pH | Nitrate (ppm) | Phosphate (ppm) | Potassium (Potash) (ppm) | |
| Layer 1 | ||||
| Layer 2 | ||||
| Layer 3 |
Data Table #2: Soil Chemistry Data
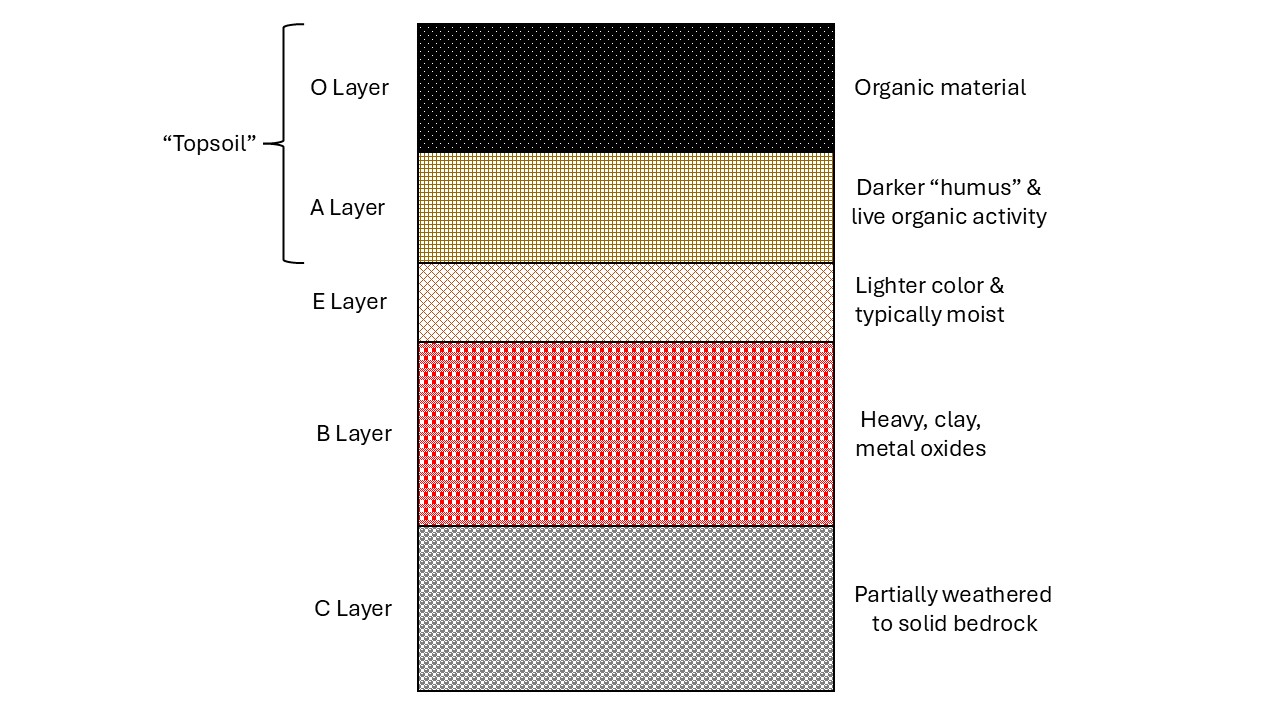
Figure 1: A representative soil profile.
Figure 2: Draw your field soil profile here. Be sure to include horizon boundaries on the left and measured depths on the right.
Other Field Observations:
- How is this land currently being used?
- What type(s) or biomass is currently being supported by the soil?
- Do you observe any signs of soil erosion in the area? If so, what are their probable causes?
Post-Lab Questions:
- How does the slope of your study area affect the use of the land?
- Can correlations be made between soil color and its nitrogen, phosphorus & potassium content? What about pH?
- Given your chemistry data for the soil, is the land good for cultivation? Why or why not? If not, what could you do to remedy the problem?
- What other uses would the land be great for? Be sure to consider the soil type, location and climate?
- What improvements to the area would you recommend to increase its value (monetary & otherwise) & decrease the degree of environmental degradation?