When accounting for capital gains and losses in the securities market, understanding reporting responsibilities and potential reductions is critical.
Learning Objectives
Recognize the broader points of capital gains reporting, alongside the potential reductions available.
Key Points
- Capital gains and losses must be reported to their respective countries for investments in debt, equity, and derivatives.
- When an investment is sold in the market for a loss or gain in a given reporting period, that investment must be reported as income on the income statement.
- When an investment is held over the reporting period, it is an asset on the balance sheet and reported accordingly.
- There are a wide variety of tax reductions on certain investment types, and understanding the existing legislation for reductions or deferments can be a significant value add for organizations.
Key Terms
- capital gains: Values captured from the trade of assets on the securities market.
- Securities: Assets purchased in the securities market, such as equity, debt and derivatives.
Securities to Report
Both organizations and individual investors trade a wide variety of financial securities with the intention of gaining returns upon these investments. Securities include exchanges involving:
- Debt securities bonds, banknotes, debentures, etc.)
- Equity (mutual funds, stock, commodities, etc.)
- Derivatives (options, forwards, futures, swaps, etc.)
Reporting Obligations
Capital Gains
Most commonly, reporting of investments will fall under the reporting of capital gains. Both organizations and individuals must report any and all capital gains within a given time period. These capital gains are profits derived from the sale of investments, which is to say that existing investments where capital is still tied in the underlying asset it not taxable (though it must be reported on the balance sheet for organizations as assets).
When profits from short term investments are derived in a taxation period for an organization, this profit is reported on the income statement and taxed accordingly. Capital gains taxes can differ based on the duration and type of investment made, but for the sake of this discussion it is enough to understand that an existing investment is an asset on the balance sheet and profit from the trade of an investment should be reported as profit (or loss) on the income statement.
Potential Reductions and Deferrals
As with most regulatory environments, it is not a one size fits all model. There are various situations where capital gains taxes can be reduced through understanding the legislation and reporting accurately and strategically. A few examples of potential reductions or deferrals in capital gains reporting include:
- In some countries, specific industry investments receive tax breaks to stimulate economic growth. For example, an investment in new green technologies is often a source of potential tax break, as it is beneficial to the broader economy and world at large.
- Retirement investments are often tax free (until withdrawn) to stimulate responsible saving and retirement planning. This allows companies to accumulate interest on what would’ve been taxable income until the capital is removed from the account.
- The sale of an asset at a loss is often a tax deductible, as are other capital losses.
- Donations of assets or capital to charity are tax deductible in most situations.
- Occasionally, the acquisition of certain assets will have the value reevaluated. In such situations, the difference between the original price and the new price may be a source of tax deduction.
While there are countless other small legislative items which may indicate tax implications on capital gains, this gives a reasonable overview of the types of considerations accountants make when considering capital gains.
Dollar Returns
The dollar return is the difference between the final value and the initial value in nominal terms.
Learning Objectives
Calculate an investment’s dollar return.
Key Points
- Dollar returns do not take into account things like the time value of money or the time frame of the investment.
- In security markets, the dollar return of the security is the difference in the final market price and the market price at which it was purchased.
- Dollar returns are useful for determining the nominal amount that the firm’s assets will change.
Key Terms
- return: Gain or loss from an investment.
The dollar return of a security is the difference between the initial and ending value.
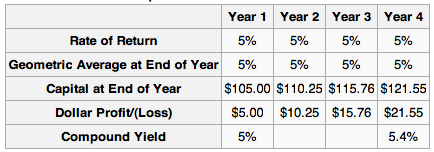
Finding the dollar return for securities that trade in open markets is a matter of finding the difference in price from year to year. For example, consider in which a $100 security earns a stated return of 5% per year. At the end of year 1, it is worth $105, which is $5 more than $100 (its value at the beginning of year 1), so the dollar return is $5. The capital value at the end of year 2 is $110.25, which is $5.25 more than at the end of year 1, and $10.25 more than at the beginning of year 1. Therefore, the dollar gain is $10.25. This continues for each successive year.
The dollar return does not take into account things like the time value of money or how the amount of return earned per year; it is simply the difference in nominal values. This means that dollar returns can provide an incomplete picture if used incorrectly. For example, suppose an investor has two investment options, both of which promise a dollar return of $1,000,000. S/he cannot tell which option is better without knowing additional details such as the risk or how long it will take to realize the returns. If the first option has a $1,000,000 return over two years and the other has a $1,000,000 return over 10 years, the first option is clearly more attractive.
Dollar returns are valuable for comparing the nominal differences in investments. If two investments have similar profiles (risk, duration, etc.), than dollar returns is a useful way to compare them. The investor will always choose the option with the higher dollar return. Furthermore, the dollar return is useful because it provides an idea about how the assets of a firm will change. If a firm is looking for an additional $50,000 from investment, they will only accept investments with a $50,000 dollar return, regardless of the percent return.
Percentage Returns
Percentage returns show how much the value of the investment has changed in proportion to the size of the initial investment.
Learning Objectives
Calculate an investment’s percentage return using CAGR.
Key Points
- Total percentage returns divide the dollar returns by the initial value of the investment. This is also the return on investment (ROI).
- Annual returns show the percentage by which the value of the asset changes in each individual year.
- Average annual percentage returns can be calculated by dividing ROI by the number of years, or by other methods such as the compound annual growth rate (CAGR) or internal rate of return (IRR).
Key Terms
- internal rate of return: IRR. The rate of return on an investment which causes the net present value of all future cash flows to be zero.
- return on investment: ROI. The dollar return of the investment divided by the initial value.
- compound annual growth rate: CAGR. A method for finding the average annual return of an investment.
The conventional way to express the return on a security (and investments in general) is in percentage terms. This is because it does not only matter how much money was earned on the investment, it matters how much was earned in proportion to the cost.
There are two types of percentage returns: total and annual. Total returns calculate how much the value of the investment has changed since it was first purchased, while annual returns calculate how much the value changed each year. When the length of time of the investment is one year, the total and annual returns are equivalent.
Total Returns
The total percentage return is based off of the final value (Vf), the initial value (Vi), and all dividend payments or additional incomes (D). If the investment is a security such as a stock, the final value is the sales price, the initial value is the purchase price, and D is the sum of all dividends received.
Return=ViVf−Vi+D
This type of return is also called the return on investment (ROI), where the numerator is the dollar return.
Annual Returns
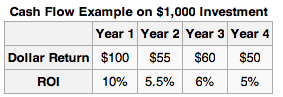
In, the ROI is calculated for each individual year by dividing the dollar return by the initial value of $1,000. To find the return for the security overall, simply sum the dollar returns and divide by the initial value. The ROI can be annualized by dividing by the number of years between the purchase and sale of the security. This is the arithmetic mean of the return.
However, this does not fully take into consideration compounding. To do so, analysts use other formulas, like the compound annual growth rate (CAGR):
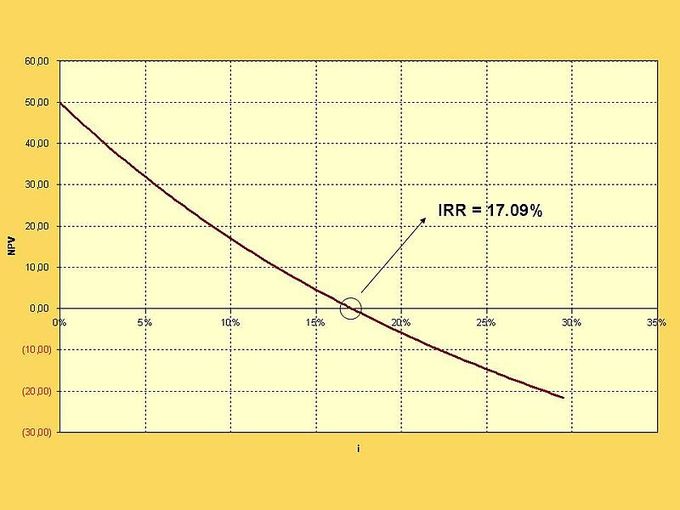
Another common method for finding the annual return is to calculate the internal rate of return (IRR). Recall that the IRR is the discount rate at which the net present value (NPV) equals 0.
Historical Returns: Market Variability and Volatility
Markets and securities may follow general trends, but exogenous factors (such as macroeconomic changes) cause variability and volatility.
Learning Objectives
Describe how historical returns can be used to predict future performance.
Key Points
- Historical returns do not guarantee future returns.
- All markets have a degree of systemic risk which means that they have a risk of collapsing due to external factors. Companies are also interconnected, so the failure of one company can have far-reaching effects.
- ” Animal spirits ” describes general investor sentiment which can affect markets, even without changes in the underlying financials.
Key Terms
- animal spirits: After Keynes (citation 1936, above), the emotional and intuitive factors that drive business decisions whether to make investment gambles.
- volatility: A quantification of the degree of uncertainty about the future price of a commodity, share, or other financial product.
- systemic risk: The risk of collapse of an entire financial system or entire market.
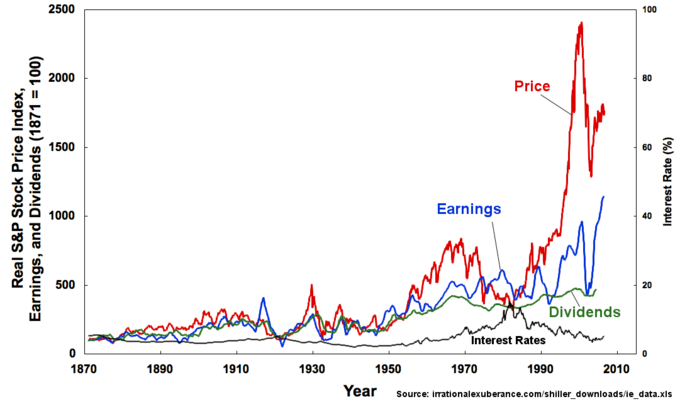
Historical analysis of markets and of specific securities is a useful tool for investors, but it does not predict the future of the market. There are general trends and expectations of future behavior, but they are just generalizations. For example, the Dow Jones Industrial Average (DJIA) has generally followed an upward trend from 1900-2009. However, an investor who looked at this graph in early 1929 and made the decision to invest because s/he would be guaranteed to make money was in for a shock when the market crashed in October 29, 1929. Past performance is not a guarantee of future performance.
Inherent in all markets is something called “systemic risk. ” Systemic risk is the risk of collapse of an entire financial system or entire market, as opposed to risk associated with any one individual entity, group, or component of a system. Macroeconomic forces, such as the Great Depression, affect the entire stock market and can’t be predicted from past market performance. The failure of one company affects all the companies who purchase from it or sell to it, which in turn affects all the companies that rely on them. These types of interlinkages are a cause of the overall market variability and volatility.
Furthermore, market variability and volatility can be the cause of what John Maynard Keynes called animal spirits. Animal spirits are the emotions felt by investors who affect markets. Expectations of investors affect how they act, which in turn affects the markets. If investors are feeling optimistic, for example, the market may go up, even without an improvement in the financials of the underlying companies.
Markets and stocks are affected by many factors beyond the information in their financial statements and past performance. Historical returns may provide an idea of the overall trend, but certainly are not enough to accurately predict future performance.
Calculating and Understanding Average Returns
Average returns are commonly found using average ROI, CAGR, or IRR.
Learning Objectives
Differentiate between the different methods for calculating the average return of an investment.
Key Points
- Average return on investment (ROI) is the arithmetic average of the total cash returns divided by the initial investment. It is useful for quick calculations and specific securities (such as bonds purchased at par ), but does not account for compounding returns.
- Compound annual growth rate (CAGR) is derived from the future value formula with compounding interest. It accounts for compounding returns.
- Internal rate of return (IRR) is the discount rate at which the NPV equals 0. It is used because it allows for easy comparison between investment options and is easy to understand.
- For all three methods, the higher the average rate of return, the more attractive the investment is.
Key Terms
- compounding returns: Returns earned on previous returns. Akin to compounding interest.
The average return of an investment can be calculated a number of ways. The three main methods are
- Return on investment (ROI)
- Compound annual growth rate (CAGR)
- Internal rate of return (IRR).
For all three methods, the higher the rate, the more desirable the investment.
ROI
To calculate the total ROI of an investment, simply divide the total dollar returns of the investment by the initial value. The average ROI is the arithmetic average: divide the total ROI by the number of periods. If the purchase of a stock led to an ROI of 15% over 5 years, the average ROI is 3% per year. This is a simple way to calculate the average return. It is useful for certain securities such as bonds. If the only source of return on a bond is the coupon payments, then this is an accurate method. A bond purchased at par that pays a 5% coupon per year, will have a return of 25% over 5 years. However, this is a very special case. Average ROI generally does not calculate the actual average rate of return, because it does not incorporate compounding returns. A stock that appreciates by 3% per year would not actually be worth 15% more over 5 years, because the gains compound.
CAGR
CAGR stands for compound annual growth rate. It is calculated by the following formula where Vf is the future value, Vi is the initial value, and t is the number of years:
CAGR, unlike average ROI, does consider compounding returns. CAGR is derived from the compounding interest formula, FV=PV(1+i)t, where PV is the initial value, FV is the future value, i is the interest rate, and t is the number of periods. The CAGR formula is what results when solving for i: the interest rate becomes CAGR, FV becomes Vf, PV becomes Vi, and the number of periods is generally assumed to be in years.
CAGR is very useful for finding the rate of return that the investment would have to earn every year for the life of the investment to turn the initial value into the future value over the given time frame.
IRR
The internal rate of return (IRR) is another commonly used method for calculating the average return. IRR is the discount rate at which the net present value (NPV) is equal to 0. Using IRR allows for easy comparison between investment options. It is also known as the effective interest rate.
CC licensed content, Shared previously
CC licensed content, Specific attribution