Operating leverage is a measure of how revenue growth translates into growth in operating income.
Learning Objectives
Identify ways to increase or decrease a company’s operating leverage.
Operating leverage is a measure of how revenue growth translates into growth in operating income.
Identify ways to increase or decrease a company’s operating leverage.
Operating leverage can be defined, simply, as the degree to which a firm incurs a combination of fixed and variable costs. Specifically, it is the use of fixed costs over variable costs in production. For example, replacing production workers (variable cost) with robots (fixed cost). Operating leverage is also a measure of how revenue growth translates into growth in operating income.

Recall that variable costs are those that change alongside the volume activity of a business, and fixed costs are those that remain constant regardless of volume. Utilizing operating leverage will allow variable costs to be reduced in favor of fixed costs; therefore, profits will increase more for a given increase in sales. This is, of course, after the breakeven point has been reached. In other words, because variable costs are reduced, each sale will contribute a higher profit margin to the company.
As operating leverage increases, more sales are needed to cover the increased fixed costs. Therefore, companies with low output would not benefit from increased operating leverage. Moreover, high levels of fixed costs increase business risk, which is the inherent uncertainty in the operation of the business. Manufacturing companies tend to invest heavily in fixed assets. Therefore, operating leverage is used much more than financial leverage for these types of firms. Operating leverage also increases forecasting risk. Therefore, even a small error made in forecasting sales can be magnified into a major error in forecasting cash flows.
Various measures can be used to interpret operating leverage. These include the ratio of fixed costs to total costs, the ratio of fixed costs to variable costs, and the Degree of Operating Leverage (DOL). All of these measures depend on sales. The ratios of fixed cost to total costs and fixed costs to variable costs tell us that if the unit variable cost is constant, then as sales increase, operating leverage decreases. The DOL tells us, as a percentage, that for a given level of sales and profit, a company with higher fixed costs has a higher contribution margin – the marginal profit per unit sold. Therefore, its operating income increases more rapidly with sales than a company with lower fixed costs (and correspondingly lower contribution margin).
Break-even analysis tells a company how much it needs to sell in order to pay for an investment.
Employ a break even analysis in the context of a company’s production process.
Recall that operating leverage describes the relationship between fixed and variable costs. Having high operating leverage (having a larger proportion of fixed costs compared to variable costs) can lead to much higher profits for a company. However, increasing operating leverage can also cause substantial losses and puts more pressure on a business. The key to understanding the appropriate amount of operating leverage lies in analysis of the break-even point.
Break-even analysis tells a company how much it needs to sell in order to pay for an investment — or at what point expenses and revenue are equal. To find the amount of units required to be sold in order to break even, we simply divide the total fixed costs by the unit contribution margin.

Unit contribution margin can be thought of as the fraction of sales, or amount of each unit sold, that contributes to the offset of fixed costs. It is simply the unit net revenue minus the unit variable cost. When sales have exceeded the break-even point, a larger contribution margin will mean greater increases in profits for a company. By inserting different prices into the break-even formula, you will obtain a number of break-even points– one for each possible price charged.
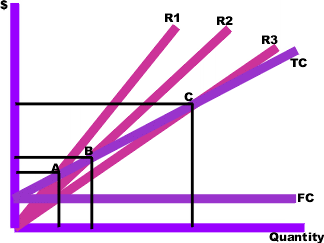
In the above graph, points A, B, and C are the break-even points. The break-even quantity at each selling price can be read off the horizontal axis and the break-even price can be read off the vertical axis.
Break-even analysis helps to provide a dynamic view of the relationships between sales, costs and profits. By providing a better understanding of the amount of success an investment or project must attain, break-even analysis gives companies a benchmark to compare to and an idea about what level of operating leverage will be ideal to generate greater profits.
The relationship between fixed and variable costs, when calculated alongside sales volume, enables modeling of operational leverage.
Calculate operating leverage using simple cost equations.
Before learning each calculation, it’s useful to frame the issue of leverage first. Operating leverage is largely predicated on fixed costs. When fixed costs are high (and variable costs are low), there is quite a bit of risk if the volume of production is low. However, strong increases in revenues will eventually result in substantially higher increase in profitability (as the relative impact of variable costs is lower, and the fixed cost is being divided by higher quantity). The equations below will demonstrate this concept in practice and clarify the concept. What’s important to keep in mind is the importance of fixed costs compared to variable costs, and the impact this can have on financial leverage.
Most of the calculations and models for leverage are relatively intuitive when looking at examples.
Let’s say you own a business selling coffee. Each cup of coffee you sell costs you about $0.10. You’re want to beat out the competition on price, so you sell your coffees pretty low at $1.00/coffee. As you can see, your variable cost is only 10% of the overall revenue. The rest of those costs (plus the profit left over) fall into the fixed costs category. After being in business for one year, you have spent a total of $100,000 acquiring the fixed assets you need (a small location, coffee machines, grinders, chairs, tables, and other random necessities).
If you sell one cup of coffee, you’ve spent $100,000.10 and made $1.00. Not so profitable at this point, as you can see. Your fixed costs compared to your total costs is pretty much 100%. To find our where you’ll break even, simply subtract the variable cost from the sale price and divide that by the fixed costs (i.e. how many $0.90 profits are required to cover the full $100,000 you owe in fixed costs). Around your 111,111 cup of coffee, you’ll find yourself just about even. After this point, pretty much every cup of coffee you sell if 90% profit and 10% cost. Not bad, right? But it’ll take a lot of leverage to get there, and therefore there is always the risk you’ll go out of business before you make it to your 111,111th cup of coffee.
So, the model for leverage in this case is fixed costs/total costs (or fixed costs/fixed costs + variable costs):
Calculating the overall degree of operating leverage is an important strategic consideration to make as often as possible. The cleanest way to few this is as the overall change in operating income compared to the overall change in sales:
It is also useful to frame this as the operating margin, which compares the overall revenue to the overall operating income. This is more of a snapshot of the current situation, while the DOL above is more in tune with relative changes over time.
At the core of degree of operating leverage is the same concept discussed in the example above. The overall amount gained per new unit sold changes based on the ratio between fixed and variable costs, and this change is what is being modeled what talking about leverage.
The use of operating leverage can multiply profits when a given break-even point is reached, but it can intensify losses when it is not.
Identify the types of companies that would benefit from higher operating leverage.
Leverage, in general, can defined as any technique that is used to multiply gains and losses. By this definition the use of leverage creates risk, and thus will always necessitate a tradeoff between risk and return. As in any situation of this sort, added risk can produce benefits for a firm, but it can also lead to detrimental consequences.
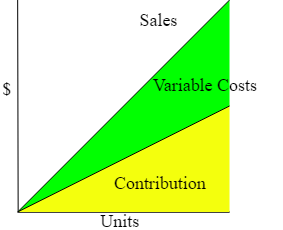
When considering the benefits of operating leverage, it is appropriate to consider the contribution margin, or the excess of sales over variable costs. When variable costs are lower, the contribution of sales to profits will be greater. In other words, a company with higher operating leverage has the potential to generate much larger profits than a company with lower operating leverage. For example, the variable costs for a software company, such as packaging and the cost of various media devices (like CDs), are very low compared to its fixed costs, such as research and development. Therefore, once a certain break-even point is reached, the contribution that sales make to profits is much higher than it would be if a greater portion of the costs were variable.
Problems can arise if a company has very high fixed costs, and if a company has difficulty selling enough units to break even on a particular investment. This is referred to as “business risk,” since it arises from the inherent risk of doing business. In other words, the uncertainty of generating a necessary amount of sales is a dilemma all businesses face. Just as the use of operating leverage can lead to greater profits, if a company is able to reach a given, break-even point, so too can the use of leverage drastically multiply losses if that point is not reached.

PPSC FIN 2010 Principles of Finance Copyright © by Cristal Brietbeil and Erik Schroeder is licensed under a Creative Commons Attribution-ShareAlike 4.0 International License, except where otherwise noted.