The statement of equity explains the changes of the company’s equity throughout the reporting period.
Learning Objectives
Analyze a company’s statement of equity and retained earnings.
The statement of equity explains the changes of the company’s equity throughout the reporting period.
Analyze a company’s statement of equity and retained earnings.
The statement of equity (and similarly the equity statement, statement of owner’s equity for a single proprietorship, statement of partner’s equity for a partnership, and statement of retained earnings and stockholders ‘ equity for a corporation) are basic financial statements.
These statements explain the changes of the company’s equity throughout the reporting period. They break down changes in the owners’ interest in the organization, and in the application of retained profit or surplus from one accounting period to the next. Line items typically include profits or losses from operations, dividends paid, issue or redemption of stock, and any other items charged or credited to retained earnings.
The statements are expected by generally accepted accounting principles ( GAAP ) and explain the owners’ equity and retained earnings shown on the balance sheet, where: owners’ equity = assets − liabilities.
A retained earnings statement is required by the U.S. GAAP whenever comparative balance sheets and income statements are presented. It may appear in the balance sheet, in a combined income statement and changes in retained earnings statement, or as a separate schedule. Therefore, the statement of retained earnings uses information from the income statement and provides information to the balance sheet.

Retained earnings are part of the balance sheet under “stockholders equity (shareholders’ equity)” and is mostly affected by net income earned during a period of time by the company minus any dividends paid to the company’s owners and stockholders. The retained earnings account on the balance sheet is said to represent an “accumulation of earnings” since net profits and losses are added / subtracted from the account from period to period.
Retained earnings are part of the statement of changes in equity. The general equation can be expressed as following: ending retained earnings = beginning retained earnings − dividends paid + net income.
Depreciation refers to the allocation of the cost of assets to periods in which the assets are used.
Calculate depreciation expense using different methods.
Depreciation refers to two very different but related concepts: the decrease in value of assets (fair value depreciation) and the allocation of the cost of assets to periods in which the assets are used (depreciation with the matching principle). The former affects values of businesses and entities. The latter affects net income.
Generally the cost is allocated, as a depreciation expense, among the periods in which the asset is expected to be used. Such expense is recognized by businesses for financial reporting and tax purposes. Methods of computing depreciation may vary by asset for the same business. Several standard methods of computing depreciation expense may be used, such as fixed percentage, straight line, and declining balance methods. Depreciation expense generally begins when the asset is placed in service. Depreciation is generally recognized under historical cost systems of accounting. Generally this involves four criteria: cost of the asset, expected salvage value (residual value of the asset), estimated useful life of the asset, and a method of apportioning the cost over such life.
There are several methods for calculating depreciation, generally based on either the passage of time or the level of activity or use of the asset.
1. Straight-line depreciation is the simplest and most often used technique, in which the company estimates the salvage value of the asset at the end of the period during which it will be used to generate revenue (useful life). The company will then expense a portion of original cost in equal increments over that period. The salvage value (residual value or scrap value) is an estimate of the value of the asset at the time it will be sold or disposed of.

2. Depreciation methods that provide for a higher depreciation charge in the first year of an asset’s life and gradually decrease charges in subsequent years are called accelerated depreciation methods. This may be a more realistic reflection of an asset’s actual expected benefit from the use of the asset: many assets are most useful when they are new. One popular accelerated method is the declining-balance method. Under this method the book value is multiplied by a fixed rate. The most common rate used is double the straight-line rate: Annual Depreciation = Depreciation Rate * Book Value at Beginning of Year.
3. Activity depreciation methods are not based on time, but on a level of activity. This could be miles driven for a vehicle, or a cycle count for a machine. When the asset is acquired, its life is estimated in terms of this level of activity. Each year, the depreciation expense is then calculated by multiplying the rate by the actual activity level.
4. Sum-of-years’ digits is a depreciation method that results in a more accelerated write-off than straight line, but less than the declining-balance method. Under this method, annual depreciation is determined by multiplying the depreciable cost by a schedule of fractions.
5. Under the units-of-production method, the useful life of the asset is expressed in terms of the total number of units expected to be produced.

Free cash flow (FCF) is cash flow available for distribution among all the securities holders of an organization.
Calculate free cash flow using all four methods.
In corporate finance, free cash flow (FCF) is cash flow available for distribution among all the security holders of an organization. They include equity holders, debt holders, preferred stock holders, convertible security holders, and so on. There are four different methods for calculating free cash flows.
1. Free cash flows = EBIT x (1 – Tax rate) + Depreciation & Amortization – Changes in Working Capital – Capital Expenditure
2. Free cash flows = Net profit + Interest expense – Net Capital Expenditure (CAPEX) – Net change in Working Capital – Tax shield on Interest Expense
Where Net Capital Expenditure (CAPEX) = Capex – Depreciation & Amortization and Tax Shield = Net Interest Expense X Effective Tax Rate
3. When Profit after Tax and Debit/Equity ratio (d) is available,
Free cash flows = Profit after Tax – Changes in Capital Expenditure x (1-d) + Depreciation & Amortization x (1-d) – Changes in Working Capital x (1-d)
4. Cash flows from operations = Earnings before Interest and Tax x (1-Tax rate) + Depreciation & Amortization – Changes in Working Capital
Free cash flows = Cash flows from operations – Capital Expenditure “”
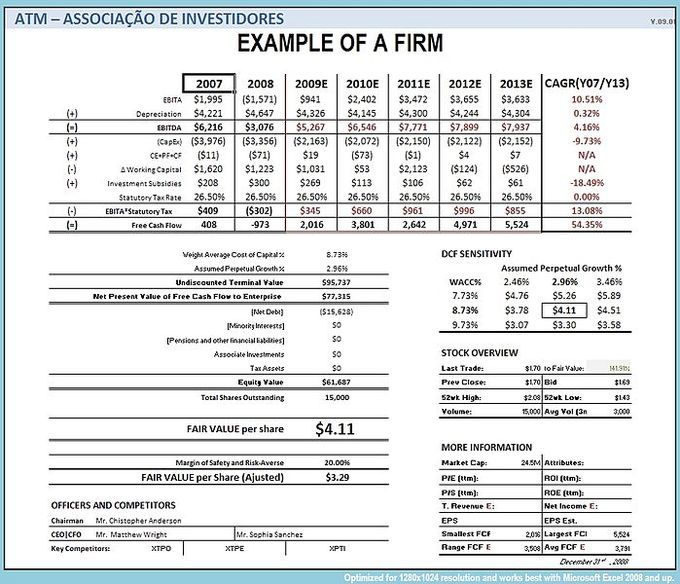
Free cash flow measures the ease with which businesses can grow and pay dividends to shareholders. Even profitable businesses may have negative cash flows. Their requirement for increased financing will result in increased financing cost reducing future income.
There are two differences between net income and free cash flow. The first is the accounting for the consumption of capital goods. The net income measure uses depreciation, while the free cash flow measure uses last period ‘s net capital purchases. The second difference is that the free cash flow measurement deducts increases in net working capital, where the net income approach does not. Some investors prefer using free cash flow instead of net income to measure a company’s financial performance because free cash flow is more difficult to manipulate than net income.
MVA = PV (EVAs); MVA is the difference between current market value and investors’ capital., and EVA is an estimate of a firm’s economic profit.
Explain the calculation and results of a business’s MVA and EVA.
Market Value Added (MVA) is the difference between the current market value of a firm and the capital contributed by investors.
If the MVA is positive, the firm has added value. If it is negative, the firm has diminished value. The amount of value added needs to be greater than the firm’s investors could have achieved investing in the market portfolio, adjusted for the leverage (beta coefficient) of the firm relative to the market. The formula for MVA is:
Where: MVA is market value added, V is the market value of the firm, including the value of the firm’s equity and debt, and K is the capital invested in the firm.
In corporate finance, Economic Value Added or EVA, is an estimate of a firm’s economic profit – being the value created in excess of the required return of the company’s investors (being shareholders and debt holders). Quite simply, EVA is the profit earned by the firm, less the cost of financing the firm’s capital. The idea is that value is created when the return on the firm’s economic capital employed is greater than the cost of that capital.
EVA is net operating profit after taxes (or NOPAT ) less a capital charge, the latter being the product of the cost of capital and the economic capital.
The basic formula is: EVA = (r – c) * K = NOPAT – c * K
where r is the return on investment capital (ROIC); c is the weighted average of cost of capital (WACC); K is the economic capital employed; NOPAT is the net operating profit after tax.
The firm’s market value added, or MVA, is the discounted sum (present value) of all future expected economic value added: MVA = Present Value of a series of EVA values.
More enlightening is that, since MVA = NPV of Free cash flow (FCF) it follows, therefore, that the NPV of FCF = PV of EVA since after all, EVA is simply the re-arrangement of the FCF formula.

PPSC FIN 2010 Principles of Finance Copyright © by Cristal Brietbeil and Erik Schroeder is licensed under a Creative Commons Attribution-ShareAlike 4.0 International License, except where otherwise noted.