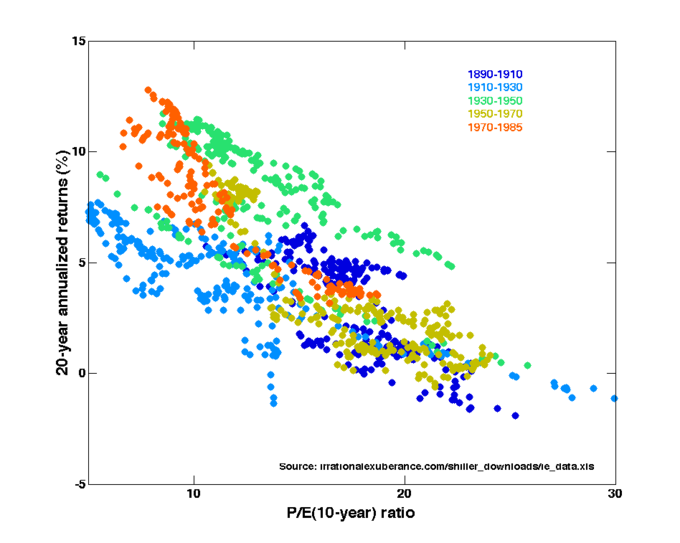
Price to earnings ratio (market price per share / annual earnings per share) is used as a guide to the relative values of companies.
Learning Objectives
Calculate a company’s Price to Earnings Ratio.
Price to earnings ratio (market price per share / annual earnings per share) is used as a guide to the relative values of companies.
Calculate a company’s Price to Earnings Ratio.
In stock trading, the price-to-earnings ratio of a share (also called its P/E, or simply “multiple”) is the market price of that share divided by the annual earnings per share (EPS).
The P/E ratio is a widely used valuation multiple used as a guide to the relative values of companies; a higher P/E ratio means that investors are paying more for each unit of current net income, so the stock is more “expensive” than one with a lower P/E ratio. The P/E ratio can be regarded as being expressed in years. The price is in currency per share, while earnings are in currency per share per year, so the P/E ratio shows the number of years of earnings that would be required to pay back the purchase price, ignoring inflation, earnings growth, and the time value of money.

P/E ratio = Market price per share / Annual earnings per share
The price per share in the numerator is the market price of a single share of the stock. The earnings per share in the denominator may vary depending on the type of P/E. The types of P/E include the following:
By comparing price and earnings per share for a company, one can analyze the market’s stock valuation of a company and its shares relative to the income the company is actually generating. Stocks with higher (or more certain) forecast earnings growth will usually have a higher P/E, and those expected to have lower (or riskier) earnings growth will usually have a lower P/E. Investors can use the P/E ratio to compare the value of stocks; for example, if one stock has a P/E twice that of another stock, all things being equal (especially the earnings growth rate ), it is a less attractive investment. Companies are rarely equal, however, and comparisons between industries, companies, and time periods may be misleading. P/E ratio in general is useful for comparing valuation of peer companies in a similar sector or group.
The P/E ratio of a company is a significant focus for management in many companies and industries. Managers have strong incentives to increase stock prices, firstly as part of their fiduciary responsibilities to their companies and shareholders, but also because their performance based remuneration is usually paid in the form of company stock or options on their company’s stock (a form of payment that is supposed to align the interests of management with the interests of other stock holders). The stock price can increase in one of two ways: either through improved earnings, or through an improved multiple that the market assigns to those earnings. In turn, the primary driver for multiples such as the P/E ratio is through higher and more sustained earnings growth rates.
Companies with high P/E ratios but volatile earnings may be tempted to find ways to smooth earnings and diversify risk; this is the theory behind building conglomerates. Conversely, companies with low P/E ratios may be tempted to acquire small high growth businesses in an effort to “rebrand” their portfolio of activities and burnish their image as growth stocks and thus obtain a higher P/E rating.
The price-to-book ratio is a financial ratio used to compare a company’s current market price to its book value.
Calculate the different types of price to book ratios for a company.
The price-to-book ratio, or P/B ratio, is a financial ratio used to compare a company’s current market price to its book value. The calculation can be performed in two ways, but the result should be the same either way.
In the first way, the company’s market capitalization can be divided by the company’s total book value from its balance sheet.
The second way, using per-share values, is to divide the company’s current share price by the book value per share (i.e. its book value divided by the number of outstanding shares).
As with most ratios, it varies a fair amount by industry. Industries that require more infrastructure capital (for each dollar of profit) will usually trade at P/B ratios much lower than, for example, consulting firms. P/B ratios are commonly used to compare banks, because most assets and liabilities of banks are constantly valued at market values.
A higher P/B ratio implies that investors expect management to create more value from a given set of assets, all else equal (and/or that the market value of the firm’s assets is significantly higher than their accounting value). P/B ratios do not, however, directly provide any information on the ability of the firm to generate profits or cash for shareholders.
This ratio also gives some idea of whether an investor is paying too much for what would be left if the company went bankrupt immediately. For companies in distress, the book value is usually calculated without the intangible assets that would have no resale value. In such cases, P/B should also be calculated on a “diluted” basis, because stock options may well vest on the sale of the company, change of control, or firing of management.
It is also known as the market-to-book ratio and the price-to-equity ratio (which should not be confused with the price-to-earnings ratio), and its inverse is called the book-to-market ratio.
Technically, P/B can be calculated either including or excluding intangible assets and goodwill. When intangible assets and goodwill are excluded, the ratio is often specified to be “price to tangible book value” or “price to tangible book”.