Learning Objectives
- Generate a cash flow forecast.
- Assess a cash flow forecast to determine future cash funding needs.
- Use pro forma financial statements and cash flow forecasts to assess the value of growth to the firm.
In this section of the chapter, we will use the forecasted income statement, forecasted balance sheet, and other information we know about the firm’s policies and goals for the coming year to generate and assess a cash flow forecast.
Create a Cash Flow Forecast
A cash flow forecast isn’t overly complex, yet it is not easy to assemble because it requires making many assumptions about the future. A cash forecast begins with the beginning cash balance, adds anticipated cash inflows, and deducts anticipated cash outflows. This identifies cash surpluses and shortages.
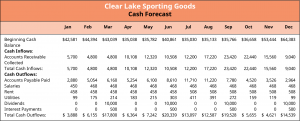
For Clear Lake Sporting Goods, for example, we see in Figure 4.15 that the company begins with cash of $42,581,000 in January of the new year. Next, it lists the cash inflows, or cash received from customers. Given the assumption that customers pay in 90-day terms, the cash flow is filled in by plugging in the sales forecast for the three prior months. For example, the cash flow from customers of $10,508 for June is the same as the net sales forecast for March (see Figure 4.13).

Next, Clear Lake identifies cash outflows, which include accounts payable, salaries, rent, utilities, dividends, and interest payments. Accounts payable are normally paid within 30 days, so the forecast for cost of goods sold for the prior month is used as an estimate of amount paid for payables. For example, in Figure 4.16, we see that the accounts payable settled in June of $8,610 is the cost of goods sold for May from the forecasted income statement.
Salaries are paid monthly and thus represent the same recurring monthly cash outflow, as does rent. Utilities, like accounts payable, are assumed to be paid within 30 days. Thus, the cash outflow for utilities is the utilities expense for the prior month from the forecasted income statement.
Management intends to pay a quarterly dividend of $10,000. Thus, in Figure 4.16, we see $10,000 cash outflows forecasted for March, June, September, and December. Interest on the long-term liability is paid quarterly. Thus, the $500 cash outflows in March, June, September, and December are simply the monthly interest expense of $167 from the income statement, summed for each quarter.

Using a Cash Forecast to Determine Additional Funds Needed
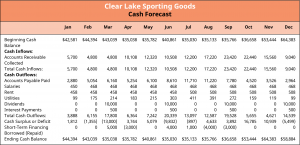
Finally, at the end of the cash flow forecast, cash outflows are subtracted from the cash inflows. This identifies whether a cash surplus (extra) or cash deficit (not enough) exists for each month. For example, in Figure 4.17, we see that in March, Clear Lake is forecasting $4,800 of cash inflows and $17,800 of total cash outflows, which results in a cash deficit of $13,000.
Clear Lake has a general policy to not let its cash balance fall below $35,000. Thus, managers need to assess their monthly balances and potential deficits and identify months when financing is necessary. For example, the deficit of $13,000 in March is enough to push the cash balance lower than $35,000. Thus, it’s estimated that the company will need $5,000 in short-term financing in March. It has an estimated surplus in April, so $3,000 of the borrowing is returned.

Assessing the Value of Growth
It’s a fairly common assumption that most, if not all, businesses want to grow. While it certainly can be good as a firm to grow in size, growth just for the sake of growth isn’t necessarily a good goal. A firm can grow in size based on customers, employees, locations, or simply sales. However, that doesn’t mean that the growth will increase profits. Growth may increase profits, but this is not a safe assumption. Scaling up operations takes careful planning, which includes monitoring the profitability of the sales and, of course, the cash flow it would require. Growing a business can require more inventory, more locations, more equipment, and more manpower, all of which cost money. Even if the forecasted growth is profitable, it may pose problems from a cash flow perspective. It’s important that the firm review not only its forecasted income statement and balance sheet but also its cash forecast, as this can reveal some serious gaps in funding depending on the extent, timing, and nature of the planned growth.
For example, assume that Clear Lake Sporting Goods intends to run a large-scale ad campaign to boost sales in its busy season. Historically, the store relied primarily on its prime location for high volumes of retail foot traffic. Managers felt, however, that given the increase in competition, they could boost sales significantly by running the ad campaign in the first quarter. The campaign would cost $30,000. Forecasts already reflect a cash deficit at the end of the first quarter of $13,000, so the additional $30,000 ad campaign, which would require payment up front, would create a much larger need for funding. It’s also important that managers look at the increased cost of doing business along with the increased cost in advertising to ensure that the move would be profitable. Fortunately, Excel or other forecasting software can be used to create a forecast with formulas that tie together, making scenario analysis such as this a much easier process.
Scenarios in Forecasting
Forecasting is almost never a linear process. In other words, we don’t do one forecast and call it good. The first draft is completed using historical data, and then changes are made a bit at a time as all potential variables are assessed for their impact on the forecast. It’s quite common to then use the work-in-progress forecast to complete scenario analysis. This is particularly true when the forecast is completed in Excel or other budgeting or forecasting software. Elements of the forecast can be changed to see what the overall impact would be to the firm. Assuming the forecast is set up using formulas in Excel or other software, a change to one figure or one variable would then “ripple” through the forecast to reflect the overall impact.
Often, a firm may complete an initial forecast (scenario) under the assumption that the economy is in a “normal state.” The firm can then alter the initial forecast for different scenarios, such as the economy in a recession or the economy in a state of expansion. This helps the firm understand different possible future states and highlights how changes in the economy such as inflation may cause revenue and expenses to increase.
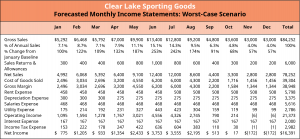
Assume that Clear Lake’s initial forecast is created under the assumption that the economy will remain average. Management also wants to know the worst-case scenario. What will their financial results look like if the economy were in a recession, for example? If management assumes their sales would drop to only 60% of the prior year sales in a recessionary economy, they could alter the formula in Excel driving their sales and variable costs, resulting in a new pro forma income statement. In Figure 4.18, we can see that net income would drop to $16,391 under this assumption, compared to the net income of $47,653 forecasted under average economy assumptions in Figure 4.13.

Though creating a full forecast in Excel can be a bit complex, it is a powerful tool that is useful for analysis. Elements can be used to vary just about anything, from something small such as a 1% increase in the cost of a product to a company-wide increase in salaries, the introduction of an entire new product line, or the purchase of a new production machine, among other possibilities.
For example, assume that Clear Lake has completed a first pass at its forecast and is reviewing the forecasted profit for the next 12 months. Managers feel the profit is currently low, as they always want to target a certain percentage. They might tinker with variables in the forecast file to see the impact on profits of potential changes they are considering. They may reduce the new salaries package by a percentage point to see if it gets them closer to their goal. They may adjust cost of goods sold by a certain percentage if they feel they can negotiate with vendors to work down their costs. They may adjust rent and see if they can find a better retail location to either reduce costs or increase sales due to increased foot traffic in a new location. They may save an entirely new version of the forecast and change it drastically to see what investing in opening a second retail location would do.
As you can see, the list of possibilities is endless. Though the main goal of financial managers may be cash planning, the power of a well-developed forecast is tremendous. It can help assess potential growth, new opportunities, and even small changes in the business as well.
Sensitivity Analysis in Forecasting
Sensitivity analysis will often look at the change in just one variable rather than the entire scenario. It examines how sensitive a particular output (commonly net income) will be to a change in a particular underlying input (sales or costs, for example). What if sales are 10% more or less than forecasted? What if the prices the firm can charge its customers are 10% more or less? What if the cost of goods sold increases by 10%? The purpose is to see which variables are crucial to “get right.” It isn’t worth spending a lot of research dollars to make sure you are accurately predicting a variable if that variable won’t notably change the outcome. However, a slight change in other variables may have significant impact.
Using pro forma financial statements created in Excel allows management to quickly generate new pro forma financials and see the impact that each possible variable might have on the overall financial results.

