14.3 Ice and Climate Change
Paul Webb
In section 8.5 we examined the causes of climate change, and the potential impacts on Earth’s ecosystems. One obvious consequence of increasing global temperatures is a decline in ice cover as the warmer climate melts the ice caps. So are we seeing a decrease in ice cover, and if so, what are some consequences of this decline?
To address these questions we must once again begin by separating sea ice and glacial ice, as each type of ice is responding to climate change in its own way, with different consequences. For example, melting polar ice is often discussed in terms of its effect on raising sea levels (section 13.7). Sea level is not really impacted by the melting of sea ice, as the formation and melting of sea ice does not change the volume of water already in the ocean. The melting of glacial ice, on the other hand, takes water that was locked up in glaciers on land and returns it to the ocean. This does increase the volume of water in the oceans, and results in rising sea levels. So we will first examine the trends in sea ice cover, and then look at the situation with glacial ice.
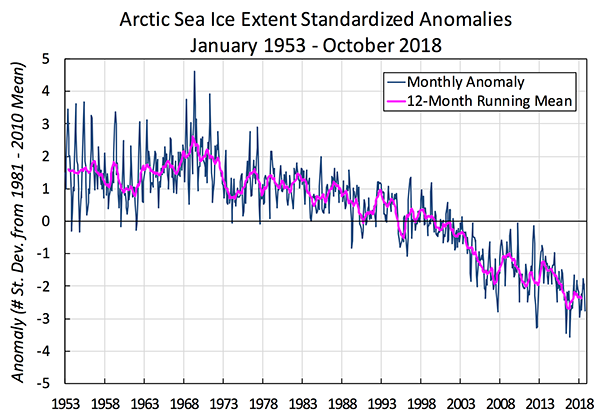
While fluctuations in sea ice cover do not dramatically impact sea level, they can be used as indicators of global warming. Satellite data show that since 1979 the average Arctic sea ice extent declined by about 3% per decade, with the rate of decline increasing in recent years (Figure 14.3.1). The year 2017 set a record for the lowest maximum Arctic sea ice extent in the 38-year history of the satellite data, the third year in a row that the record was broken. In addition, the thickness of the Arctic sea ice has also declined, from a mean thickness of 3.64 meters in 1980 to 1.89 meters in 2008. So Arctic sea ice cover is clearly in decline as global temperatures increase.

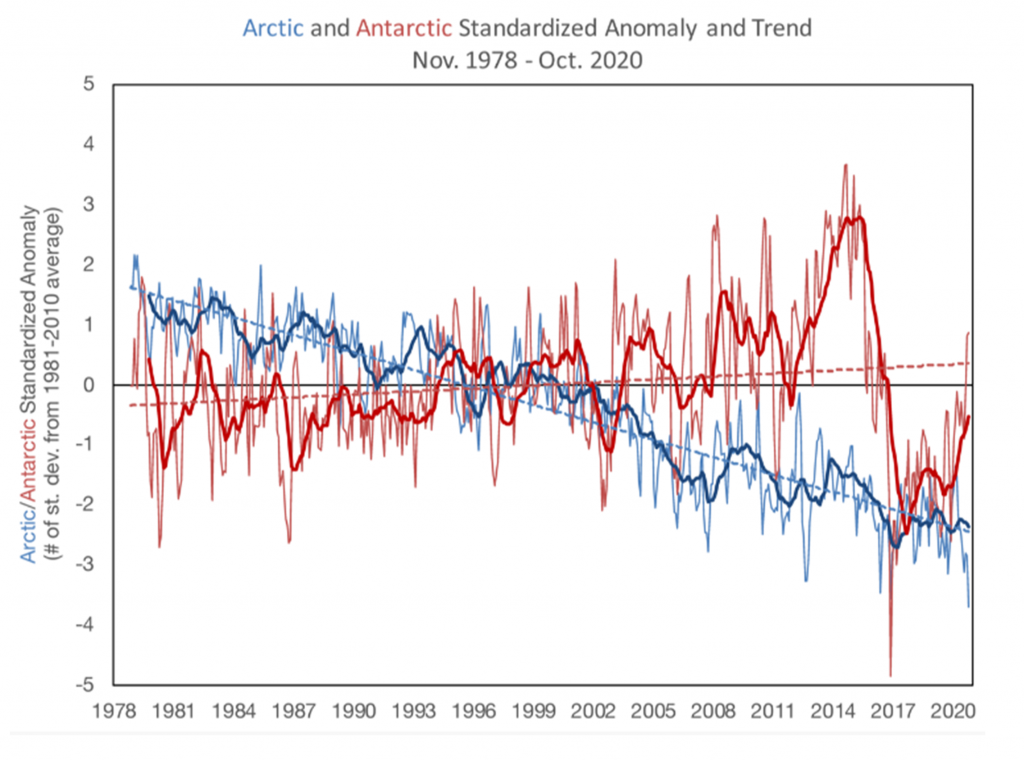
The situation with Antarctic sea ice is less clear. Antarctic sea ice cover is increasing slightly, at a rate of about 1.1% per decade, although the upward trend in the Antarctic is only about one-third of the magnitude of the downward trend seen in the Arctic (Figure 14.3.2). There are several hypotheses for why this increase is occurring, including winds, currents, and La Niña conditions (section 9.6) in the Pacific Ocean. For example, the strong Antarctic Circumpolar Current prevents warmer water from reaching the ice edge, and the winds in the region keep the water very cold, promoting ice formation. One other possible explanation is that as portions of the Antarctic get warmer there is more precipitation and increased glacial ice melt. This leads to a layer of low-density, fresher water which remains at the surface and freezes more easily than saltier water. In the Arctic, there has always been significant freshwater input from rivers, so that low-density layer is already present. Whatever the reasons for the increasing sea ice in the Antarctic, the increase is still less than the decline in the Arctic, and the overall trend for global sea ice is a loss of about 35,000 km2 per year since 1979.

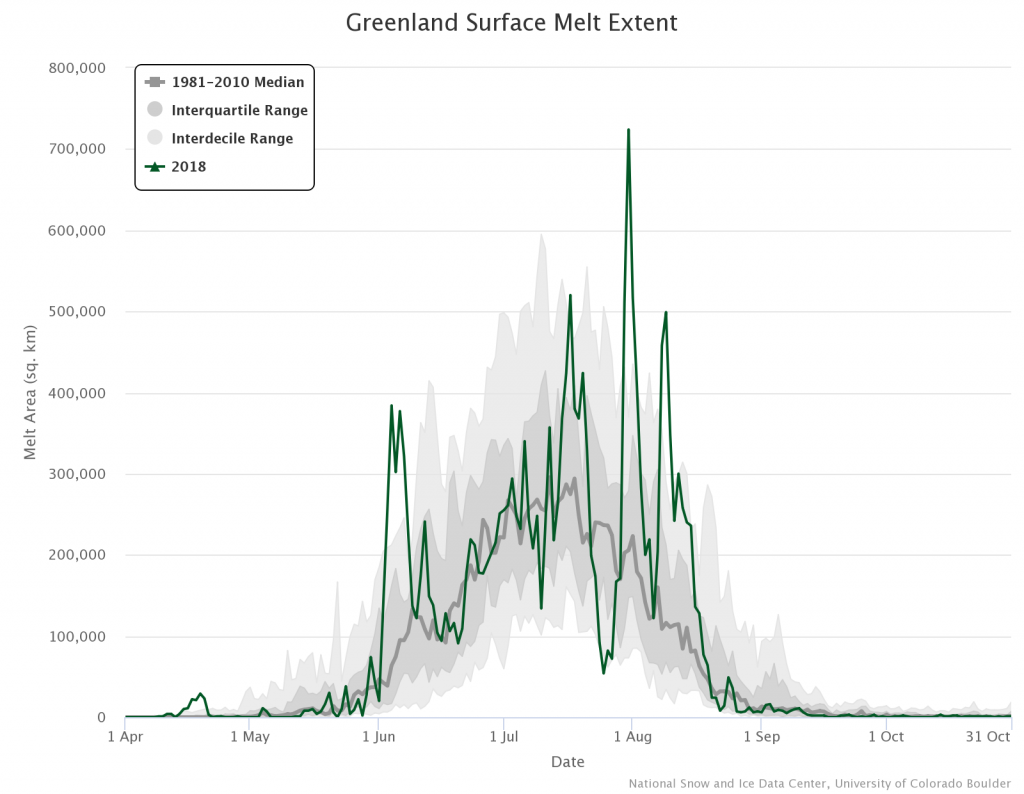
In terms of glacial ice, once again the Arctic is showing signs of significant ice loss, particularly in Greenland; from 1979 to 2006, summer melt on the Greenland ice sheet increased by 30%. Ice melt during 2016 was the tenth highest on record (Figure 14.3.3). Once again, the trends are less defined in Antarctica. Warming and ice loss is occurring in the West Antarctic ice sheet and along the Antarctic Peninsula, which has warmed 2.5 oC since 1950. However, there is no clear warming trend in East Antarctica, and some of these areas are accumulating ice. Overall, the Antarctic ice is currently relatively stable, particularly when compared to Greenland. If the polar ice sheets were to melt, they would have a dramatic impact on sea level. It is estimated that melting of the Greenland ice would raise global sea level by about 7 m, while complete melting of the Antarctic ice sheet would result in a rise of almost 60 m!

Additional links for more information:
- Get the latest updates on sea ice and glacial ice conditions at the National Snow and Ice Data Center website: https://nsidc.org/
ice formed from the freezing of seawater (14.1)
ice formed from the accumulation and compression of snow into glaciers (14.1)
a periodic climatic situation in which colder than normal water extends throughout the equatorial Pacific (9.6)

