13.7 Sea Level Change
Modified from "Physical Geology" by Steven Earle*
Paul Webb
Sea level change has been a feature on Earth for billions of years, and it has important implications for coastal processes, estuaries, and both erosional and depositional features. There are two main mechanisms of sea level change, eustatic and isostatic, as described below.
Eustatic sea level changes are global sea level changes related to changes in the volume of water in the ocean. These can be due to changes in the volume of glacial ice on land, thermal expansion of the water, or to changes in the shape of the seafloor caused by plate tectonic processes. For example, seafloor spreading widens an ocean basin, thus changing its volume and affecting sea level.
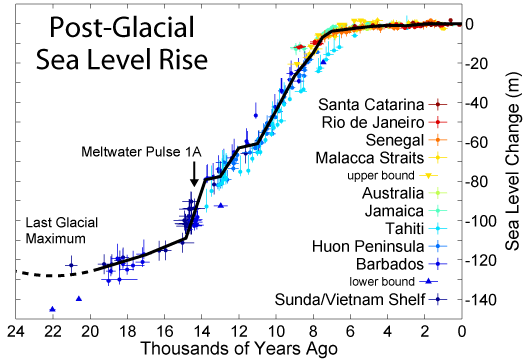
Over the past 20,000 years, there has been approximately 125 m of eustatic sea level rise due to glacial melting. Most of that took place between 15,000 and 7,500 years ago during the major melting phase of the North American and Eurasian Ice Sheets (Figure 13.7.1). At around 7,500 years ago, the rate of glacial melting and sea level rise decreased dramatically, and since that time, the average rate has been in the order of 0.7 mm/year.

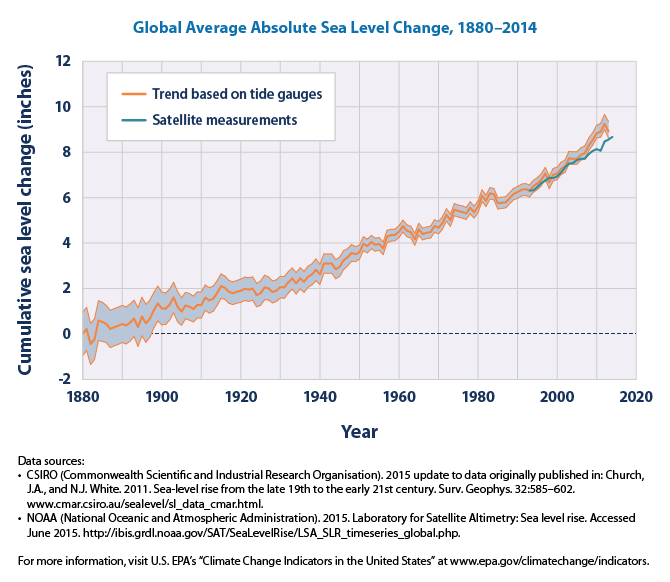
Anthropogenic climate change led to accelerating sea level rise starting around 1870. Since that time, the average rate has been 1.1 mm/year, but it has been gradually increasing. Since 1992, the average rate has been 3.2 mm/year (Figure 13.7.2). Much of this is due to increased glacial melting as the global climate gets warmer (section 14.3), but a large part is due to thermal expansion of the water. As water warms, the molecules gain more kinetic energy and move faster and farther apart; the result is that the same amount of water now takes up more space. So even without the input of new water from melting ice, warming ocean temperatures will cause sea level to rise.

Isostatic sea level changes are local changes caused by subsidence or uplift of the crust related either to changes in the amount of ice on the land, or to growth or erosion of mountains. Almost all of Canada and parts of the northern United States were covered in thick ice sheets at the peak of the last glaciation. Following the melting of this ice, there has been an isostatic rebound of continental crust in many areas. This ranges from several hundred meters of rebound in the central part of the Laurentide Ice Sheet (around Hudson Bay) to 100 m to 200 m in places such as Vancouver Island and the mainland coast of British Columbia. In other words, although global sea level was about 130 m lower during the last glaciation, the glaciated regions were depressed at least that much in most places, and more than that in places where the ice was thickest. Tectonic processes, such as the uplift of crust, can also cause localized changes in sea level.
*”Physical Geology” by Steven Earle used under a CC-BY 4.0 international license. Download this book for free at http://open.bccampus.ca
a partially enclosed body of water where seawater is diluted by freshwater input (13.6)
sea level change related to a change in the volume of the oceans, typically because of an increase or decrease in the amount of glacial ice on land (13.7)
the concept that the Earth’s crust and upper mantle (lithosphere) is divided into a number of plates that move independently on the surface and interact with each other at their boundaries (4.1)
resulting from the influence of humans (8.5)
the increase in the volume of a body water as its temperature rises and its density decreases (13.7)
the effect on relative sea level of a vertical movement of the crust resulting from a change in the mass of the crust (e.g., from losing or gaining ice) (13.7)
the uppermost layer of the Earth, ranging in thickness from about 5 km (in the oceans) to over 50 km (on the continents) (3.2)
the equilibrium position reached by a block of crust floating on the underlying fluid mantle (3.2)
the Earth’s crust underlying the continents (as opposed to ocean crust) (3.2)
the continental glacier that extended across central eastern North America during the Pleistocene, covering most of Canada and a significant part of the United States (3.2)

