6.2 Temperature
Paul Webb
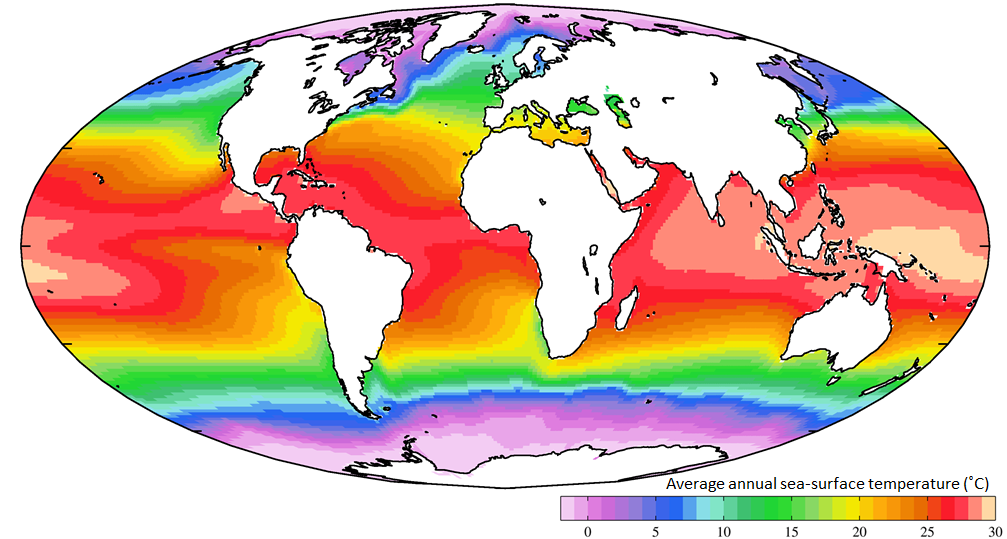
Generally ocean temperatures range from about -2o to 30o C (28-86o F). The warmest water tends to be surface water in low latitude regions, while the surface water at the poles is obviously much colder (Figure 6.2.1). Note that at equivalent latitudes, water on the eastern side of the ocean basins is colder than the water on the western side. This has to do with the pattern of surface currents, as described in section 9.1. Even though surface water can be quite warm, most of the water in the oceans is deeper, colder water, so that the average temperature of the entire ocean is about 4o C, which is roughly the temperature inside your refrigerator.
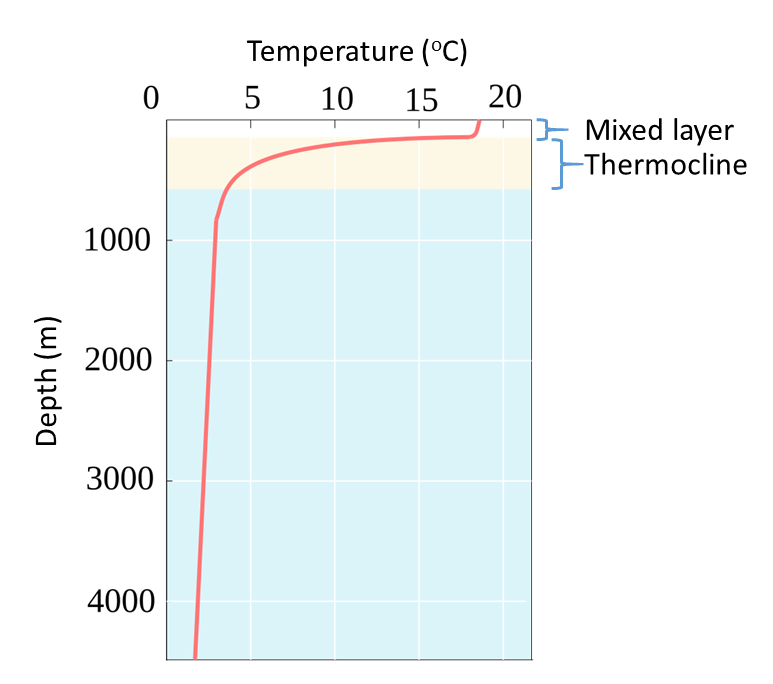
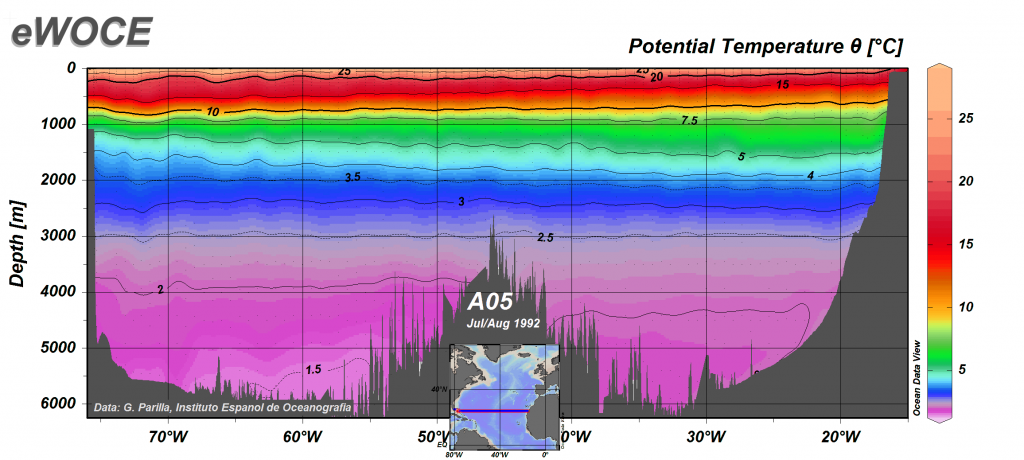
A typical temperature profile for open ocean, mid-latitude water is shown in Figure 6.2.2. Water is warmest at the surface, as it is warmed by the sun, and the sun’s rays can only penetrate depths less than 1000 m (section 6.5). Since the surface water is warmer it is also less dense than the deep water (section 6.3), so it remains at the surface where it can be warmed even more. Temperature is fairly constant in the upper 100-200 m in what is called the mixed layer. The mixed layer results from surface winds, waves, and currents that mix the upper water and distribute the heat throughout this layer. Below the mixed layer there is a rapid decline in temperature over a fairly narrow increase in depth. This is called the thermocline. Below the thermocline the deep ocean temperature is fairly constant at about 2o C, continuing down to the bottom. There is little temperature change in the deep ocean, as it is far removed from significant heat sources, making it one of the most thermally stable regions on earth. Temperature may fluctuate by less than half a degree per year in the deep ocean (Figure 6.2.3).
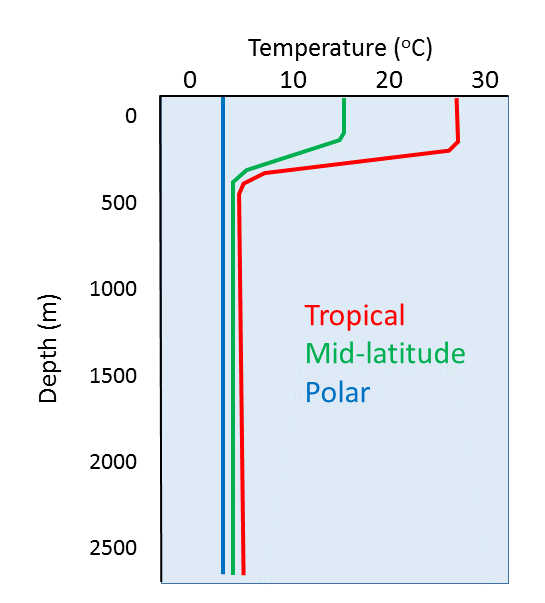
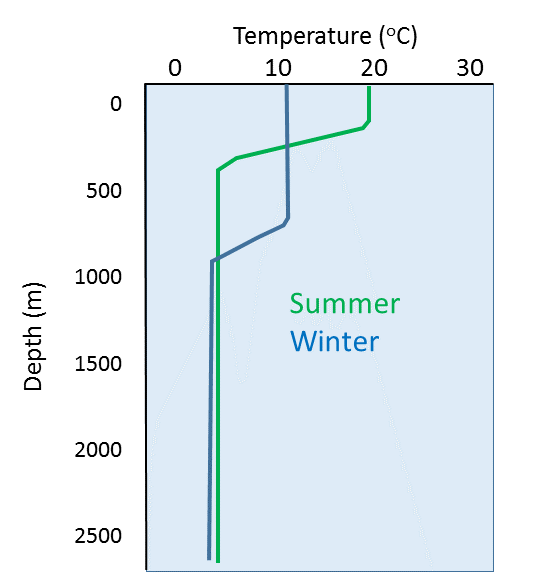
Temperature profiles vary at different latitudes, as the surface water is warmer near the equator and colder at the poles. In low latitude tropical regions the sea surface is much warmer, leading to a highly pronounced thermocline (Figure 6.2.4). Additionally, there is not much seasonal change in surface temperature in tropical regions, so there is little seasonal change in the profiles. In high latitude (polar) regions, there is little difference between the surface temperature and the deep water temperature, and temperature is fairly constant (and cold) at all depths. Polar waters therefore lack a strong thermocline, and as with tropical water, there is little seasonal change in temperatures. Mid-latitude temperate regions show greater seasonal fluctuations in surface temperature than the poles or the tropics; an 8-15o C difference from summer to winter in temperate zones, compared to only ~2o C in polar and tropical areas. In temperate regions, the surface water is much warmer in the summer and the thermocline is more pronounced compared to the winter months. But in the winter the thermocline is deeper at mid-latitudes than it is in the summer. This is because winter storms churn up the surface water more than occurs in the summer, creating a deeper mixed layer and thus a deeper thermocline (Figure 6.2.5).
Due to the high heat capacity of water, daily fluctuations in ocean temperature are fairly insignificant.
the distance north or south of the equator, measured as an angle from the equator (2.1)
the topmost layer of the ocean, where winds, waves, and currents mix the water so that conditions are relatively constant; approximately the top 100 m (5.3)
a region in the water column where there is a dramatic change in temperature over a small change in depth (6.2)

