Module 3: Reading and Videos Part 1
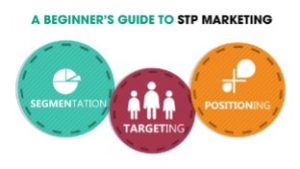
STP
Marketers all agree that traditional methods such as: segmentation, targeting and positioning (STP) not Stone Temple Pilots, are core marketing principles to properly analyze the market. Companies would love to sell to everyone, but this is not realistic and to do so would have to change their marketing methodologies of every person. Marketers must understand the market(s) they serve. A market is a group of people who gather to buy and sell products and/or services. Within each market, there are subgroups with unique needs/preferences
Marketers need to know these subgroups and how their needs/preferences differ
Companies need to answer questions about how to target those customers based upon the marketing mix/4 Ps of marketing. The answer to these questions can be solved using segmentation, targeting, and positioning.
Market segmentation enables companies to divide consumer and business markets into smaller groups with shared characteristics based on
- Demographic and lifestyle information related to customers
- Geographic location
- Attitudes and behavioral traits
- Psychological orientation
- Other similar types of information
Implementing STP Using Data
Segmenting a market using shared characteristics is referred to as cluster analysis. Cluster analysis uses algorithms to explore several types of relationships and then develops smaller groups from larger populations based on similar characteristics.
Marketers use these insights to:
- Improve marketing strategies
- Better allocate resources
- Gauge new product development
- Select the most receptive test markets
Tools for cluster analysis include
- SPSS Modeler
- SAS Enterprise Miner
- R Programming
- Python
Clustering algorithms can identify groups with similar traits. When companies understand these groups, they can target each group using strategies specifically fitting their needs and wants. The results help companies develop targeted marketing campaigns and tactics. They use demographic and behavioral characteristics to identify loyal customers. Understanding these customers enables them to develop new products and targeted marketing, but how does a cluster analysis work?
Cluster analysis organizes data into two or more similar groups which exhibit
- Within cluster (intra-cluster) homogeneity or similarities
- And dissimilar characteristics (heterogeneity) between groups (inter-cluster)
- Similarities between groups is calculated using various measures of the distance between groups
- Smaller distances represent greater similarity
No previous established dependent variable is specified with cluster analysis. So, the technique is considered an unsupervised learning. The goal of cluster analysis is to model the underlying structure and distribution of characteristics in the data to separate a dataset into homogenous subgroups. Using cluster analysis, a retailer might be interested in segmenting customers based on income, distance to the store, and the number of purchases at a particular location.
- Cluster analysis is an efficient and effective method of segmenting the market to improve company performance
- To apply cluster analysis, you must know how the technique works
- o First, there are several distinct types of cluster analysis
- o The two most common are k-means clustering and hierarchical clustering
K-Means Clustering
K-means clustering uses the average data point in the cluster and minimizes the distance to individual observations
- The number of clusters (k) is initially specified by the analyst
- Results for the different clusters are then examined with the best number of different homogenous groups chosen, based on what helps develop the most effective strategy
- The process starts with the analyst deciding on k initial subgroups – a good starting number is 2, or k (2)
- Next, the algorithm randomly assigns each observation to one of the k (2) clusters
- A cluster seed is randomly selected and designated as the initial cluster centroid
- Then, cluster centroids (means) are calculated
- Using cluster centroid values, the k-means algorithm continues to reassign observations based on the proximity of the observation to the cluster centroid
- o An observation may start in one cluster but then be reassigned to a new cluster if the observation is closer to the centroid of the new cluster
- In short, an overall group mean is calculated, and observations are assigned to the group they are closest to in terms of their characteristics
- Clustering continues to evolve until the error produced by combining individuals into clusters cannot be further reduced – used in large sample sizes due to its simplicity
How is the quality of clusters objectively evaluated?
- The analyst uses a line chart to evaluate the reduction in cluster error
- To obtain the most accurate cluster results, it is best to begin with data that has been standardized using z-scores or min-max
- K-means clustering can only be applied to numerical data
- Since k-means uses the average data-point in the cluster as a starting point
- The mean value is applicable only when the mean is relevant for all the data
- This requires that all data be numerical
- If the data is categorical (1 or 0 coding for Yes or No), the mean would be meaningless
