Module 2: Review Activities

In this module, through data analysis, we will explore patterns while focusing on addressing the following:
- Analyze the importance and limitations of data and cognitive analytics.
- Compare and contrast modeling techniques in relationship to time, budget, audience, and marketing channels including auditing and reconciling data.
- Summarize the benefits and detriments of using Artificial Intelligence (AI) and Automated Machine Learning Model (AMLM).
Read “Module 2: Readings and Videos Part II” document before completing the following review activities.
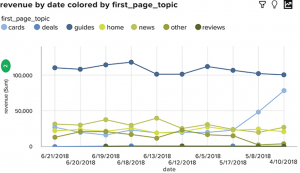
Review Activity #1 Understanding Insights from Cognitive Analytics
This activity is important because data analysis through exploration is an essential process. Through this step, marketers become detectives exploring and identifying data patterns. Exploratory data analysis provides a summary of the main characteristics within the data. A company is interested in knowing which page topics are having the most success when it comes to revenue. Understanding this will allow them to update existing page topics so the most successful topics are being used most frequently.
The goal of this activity is to demonstrate your understanding of insights when using cognitive analytics.
Answer each question based upon insights from the Exhibit.
Review Activity #2 Identifying Patterns in Data
This activity is important because data analysis through exploration is an essential process. Through this step, marketers become detectives exploring and identifying data patterns. Exploratory data analysis provides a summary of the main characteristics within the data. A company is interested in knowing which regions are producing the most revenue. Understanding this will allow them to update digital advertising campaigns to focus on underperforming areas.
The goal of this activity is to demonstrate your understanding of insights when using cognitive analytics.
Answer each question based upon insights from the Exhibit.
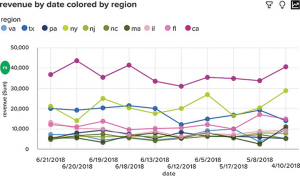
Source of data: Red Ventures
Review Activity # 3 Comparing Insights from the Data
This activity is important because data analysis through exploration is an essential process. Through this step, marketers become detectives exploring and identifying data patterns. Exploratory data analysis provides a summary of the main characteristics within the data. A company is interested in knowing which sources customers use that are yielding the most revenue. Understanding this will allow the company to determine where to focus more efforts and investments.
The goal of this activity is to demonstrate your understanding of insights when using cognitive analytics.
Answer each question based upon insights from the Exhibit.
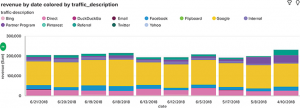
Source of data: Red Ventures
In a two-page report:
Part 1: Create three different business scenarios where an exploratory data analysis using cognitive analytics might be helpful.
Part II: Using the different scenarios, determine internal and external data that might be useful in better understanding the relationship between the company and customers.
Review Activity #4 Evaluating Visualization Insights
This activity is important because it will demonstrate how quickly data visualization can help you understand business insights even if this is your first time seeing the business problem.
The goal of this activity is to demonstrate how insights can be derived from data visualization.
Select your answer to each of the multiple-choice questions based on the data contained in the following charts.
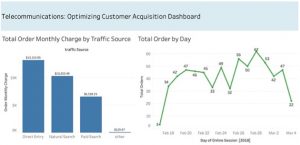
Source of data: Red Ventures
Review Activity #5 Common Types of Charts
It is critical to know that the type of chart you use depends on the variable types and the story you are trying to tell with the graph.
The goal of this activity is to demonstrate your understanding of the different types of charts based on the data scenario presented.
For each item, select the correct type of chart to display these relationships.
Research a public Tableau dashboard at the following link: Viz of the Day and answer the following questions in one-two paragraphs each: Howe are the principles and elements of design used in the dashboard? How does the dashboard tell a story?
Develop an elevator speech of no more than three hundred words and no longer than two minutes presenting insights from the last two weeks to the management team at your company. You will need to convey insights clearly and quickly. How would a dashboard facilitate your presentation?
Review Activity #6 Defining Automated Machine Learning
There are four key steps in the Automated Machine Learning (AutoML) process: data preparation, model building, creating ensemble models, and model recommendation. When examining or reporting on a model, there are many questions that can arise that are related to each of these steps. This activity is important because it will demonstrate your understanding of what questions might arise when looking at or reporting on the AutoML model’s decision or recommendation.
The goal of this activity is to anticipate and understand that questions should be considered or might be asked upon examining or reporting results of an Automated Machine Learning model.
For each question, determine the correct step in the AutoML process where the question might arise.
Based upon your understanding clearly and concisely identify the variables necessary when using AutoML to predict customer churn (customers that stop purchasing from the brand) for your favorite clothing brand.
Additional Fun Activities that reinforce concepts from the readings and videos documents:
A couple of fun in-class activities to bring the topic to life as students get hands-on experience with AI. Note that some of the exercises use groups. However, these can also be applied to individuals.
Teachable Machine is an experiment for users to start exploring how machine learning works.
It lets individuals teach a machine using a camera – live in the browser, no coding required. It’s built with a library called deeplearn.js, which makes it easier for a web developer to get into machine learning by training and running neural nets right in the browser.
- Go to https://teachablemachine.withgoogle.com/ and hit “let’s go”
- Enable the browser to use the camera on a laptop (if applicable)
- Following the instructions, teach the machine to respond by acting out different body movements
The whole activity takes about five minutes. The detailed instructions and code can be accessed at https://github.com/googlecreativelab/teachable-machine
MACHINE LEARNING QUICK DRAW ACTIVITY (Online)
To demonstrate machine learning, we will ask the class to play Google Creative Lab’s “Quick, Draw,” a game in which a neural net attempts to guess what a user is drawing.
The game provides six drawing assignments and allows itself 20 seconds to try and guess what you are drawing.
Instructions for students:
STEP 1: Ask students to log onto their computers and visit https://quickdraw.withgoogle.com
STEP 2: Instruct students to select the button that says “Let’s draw!”
STEP 3: Instruct students to press the “Got It!” button once they understand their drawing assignments.
STEP 4: Once the students have completed their drawing assignments, poll the classroom to see how the system performed.
STEP 5: Ask each group to tally the number of times the computer guessed their artwork correctly.
STEP 6: Instruct students to click on one of the pictures the computer got wrong and look to see what the computer’s closest matches were.
STEP 7: Instruct students to scroll down to see other examples of drawings people have contributed.
STEP 8: Reward the group that performed the best in the activity.
In-Class Activity Akinator
To demonstrate deep learning, we will ask the class to become familiar with Redstone Special’s “Akinator,” a game based on twenty questions geared at determining which character the player is thinking of. The Akinator is an artificial intelligence program that can find and learn the best questions to ask the player.
Pull the site up on the projector and guide the students through the following process.
STEP 1: Ask students to log onto http://en.akinator.com/
STEP 2: Tell students to think of any character, real or fictional.
STEP 3: Instruct students to press the “Play” button to the right of the language settings.
STEP 4: Instruct students to enter their ages into the player information pop-up.
STEP 5: Instruct students to answer each of the Akinator’s questions to the best of their abilities given the available responses.
STEP 6: Once everyone has finished, poll the classroom to see if anyone was able to beat the Akinator.
