Module 3: Review Activities

In this module, through data analysis, we will explore patterns while focusing on addressing the following:
- Explain the importance of cluster and market basket analysis in the consumer buying process.
- Analyze text data to understand consumer behavior.
Read “Module 3: Readings and Videos Part 3” document before completing the activities.
Review Activity #1 Practice a Cluster Analysis
Collect information on at least three characteristics. Consider how you could use this spreadsheet of data to put people into distinct groups.
Steps for Using with Excel
Here are the steps for running a basic cluster analysis with Excel. Refer to this video: How K-mean clustering groups data-: A Simple Example for extra help. *See the example file in the materials folder
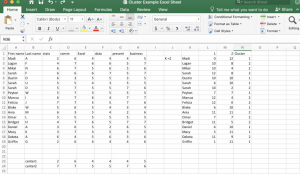
- Open the excel file. Randomly select k rows. In the example provided, k=2. Note that selecting rows that have widely differing data will expedite the clustering processes. Label these rows are center1 and center2.
- Create a new table to the right that has each entry name as the first column, center1 and center2 as the next two columns, and cluster as the 4th. To fill in center1, calculate the linear distance between the two vectors by adding the absolute value of the difference between every variable.
![]()
Repeat this step to fill in center 2 as well. Note that to avoid retyping formulas, simply drag the corner of the box where the formula is listed across all boxes you wish to fill with the same formula. Use $ sign to fix a certain variable when dragged. To fill in the cluster column, select whichever center has the minimum distance. For example, in the first line shown below (Madi), since 0 is less than 12, the cluster columns list 1.
- Copy and paste the table on the right below so that the information is not lost when we change it. Remember to select paste special and “values” so just the numbers are copied, not the formulas.
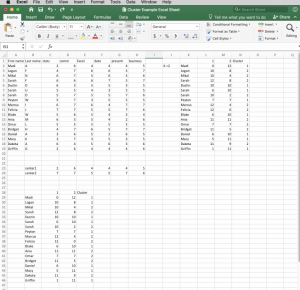
- The next step is to adjust our original center1 and center2 values. We do this by averaging the values from the corresponding clusters. For example, the “stats” column for center1 would be the average “stats” values of all the names that had been labeled as Cluster 1 in Step 2.
=AVERAGE (C2, C6, C7, C9, C12, C16, C17, C19)
This will update the distances for column 1 and 2 on the table on the right as well, although you must then adjust the Cluster labeling by reassigning which center had the minimum value, based on the updated distances.
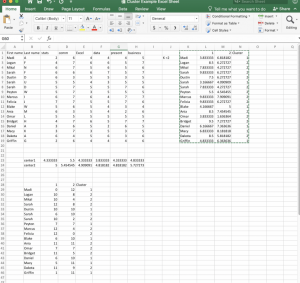
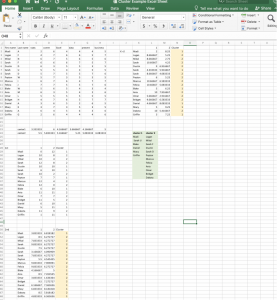
- Next, compare the current cluster assignments to the ones at the end of Step 2. If they are not identical, repeat Step 3 and Step 4 until the assignment labels no longer differ between the preceding labels and updated labels.
- Once the assignment labels do not differ, go ahead and officially assign each name to a cluster. As seen in this example, the labels highlighted in yellow do not differ, so the names were officially assigned to a cluster (highlighted in green).
Review Activity #2
What kind of marketing strategies can market managers utilize that meet the needs and wants of customers within each of the four clusters using a softball analogy in segment name but types of customers in the figure below?
| Segment Name | Customer Characteristics | Definition |
| Bench Warmer | High Recency
Low Frequency Low Monetary Value |
Low-value customers because they produce less monetary value, have not visited the online store in a while, and do not have a history of frequent purchases This segment can potentially benefit from new product announcements. |
| Within Starting Lineup | Medium Recency
Medium Frequency Medium-Low Monetary Value |
Medium-value customers because they produce a modest monetary value and fall in the middle when it comes to frequency of purchase history and most recent visit to an online store. The segment might benefit from cross-selling others. |
| All Star | High Recency
Medium Frequency Medium-High Monetary Value |
Valuable customers because they produce a modest monetary value and fall in the middle when it comes to the frequency of purchase history of most recent purchases. This segment could use a reminder to return for a special offer. |
| MVP | Low Recency
High Frequency High Monetary Value |
Extremely valuable customers because they produce high monetary value, have a history of frequent purchases; and have recently visited the online store. This segment could be targeted with exclusive offers to the best customers. |
Review Activity #3 Applying Cluster Analysis
This activity is important because it will demonstrate your understanding of when cluster analysis is appropriate to use.
The goal of this activity is to see what types of problems will be ideal for applying cluster analysis.
Select “Yes” if the problem can be answered using cluster analysis or “No” if the problem cannot be answered using cluster analysis.
Review Activity #4 Evaluating K-means Clustering
K-means clustering uses the mean value for each cluster and minimizes the distance to individual observations. Results for the different clusters are then examined with the best number of different homogenous groups chosen. It is critical to understand how to objectively evaluate the k-means clustering results.
The goal of this exercise is to evaluate the k-means clustering results using an elbow chart and silhouette score.
Using the charts, what is the optimal number of clusters for the data?
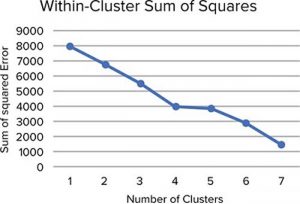
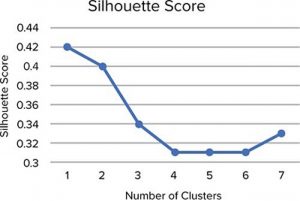
and why?
Review Activity #5 Understanding Measures That Indicate the Reliability of the Associations
When conducting market basket analysis, the Apriori algorithm identifies combinations of items in datasets that are associated with each other. Associations are identified based on the frequency in which the products occur together in the basket. When you use market basket analysis, there are three measures that indicate the reliability of the associations. The three measures are (1) support, (2) confidence, and (3) lift. This activity is important because it will demonstrate your understanding of how support, confidence, and lift are calculated and interpreted.
The goal of this activity is to show your understanding of how to calculate and interpret each measure. There are 10 grocery store transactions in the dataset.
Use the frequency data table listed below to calculate and select the correct interpretation for each measure.
Table: Frequency Data for Grocery Store
| Items | Frequency |
| Soda | 9 |
| Milk | 8 |
| Bread | 6 |
| Salty Snacks | 7 |
| Beer | 7 |
| Soda, Milk | 8 |
| Soda, Bread | 5 |
| Soda, Salty Snacks | 6 |
| Soda, Beer | 5 |
| Milk, Bread | 5 |
| Milk, Salty Snacks | 5 |
| Milk, Beer | 4 |
| Bread, Beer | 4 |
| Salty Snacks, Beer | 5 |
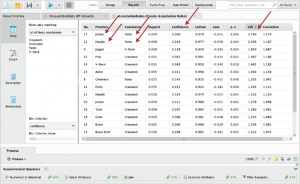
Review Activity #6
How could marketing managers use the results from the figure below when making email marketing and general promotion decisions?
Review Activity #7 Understanding the Text Analytics Process
There are four key steps in the text analytics process: text acquisition and aggregation, text preprocessing, text exploration, and text modeling. This activity is important because it will demonstrate your understanding of what types of tasks might be completed within each step.
The goal of this activity is to understand what types of tasks might be completed within each step of the text analytics process.
Review Activity #8 Converting Unstructured Data Into Structured Data Using a Matrix Format
The term-document matrix (TDM) uses rows and columns to separate the text, as shown in Exhibit 10-5. The rows correspond to terms (or words), while columns show document names, and a count of occurrences in binary form fills the cells of the matrix. The purpose of this activity is for you to understand how a TDM is created.
The goal of this activity is for you to understand how to convert unstructured data into structured data using a matrix format.
