Module 1: Reading and Videos Part 2

Big data is available to almost all companies throughout the world, but it is only an asset when it provides value.
Overview
External data has been part of the history of marketing. In the earliest forms of direct mail to moving into the computer age with the advent of the World Wide Web and email. Over time Google formed into the world’s largest search engine and all this data has become essential for a marketer’s toolkit. One of the most popular sources of external data for marketers over the past decade or more is “Big Data.” Big data includes any large dataset, typically with data measurables in terabytes or more. Large datasets are a core organizational asset that generates new opportunities and creates significant competitive advantages. Building a smart data infrastructure that enables real-time decision-making requires a strong data strategy that is well aligned with the overall business strategy. Big data is available to all companies throughout the world, but it is only an asset when it provides value.
Database Management Systems (DBMS)
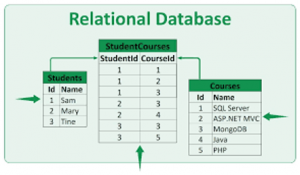
Have you ever considered how big data is organized to create smart data that provides value? All data is stored and organized into a database. An example of a database is when employees search for customer information or customers for a product online this is customer relationship management (CRM). This type of database is a relational database because it is the collection of interrelated data items organized using software programs to manipulate and access data. Relational data is accessible by a database management system called structured querying language (SQL. A query can be used to join, select, and manipulate when data consistently maintain the same properties because they require predefined structures.
On the other hand, non-relational databases, also known as NoSQL databases, can store large volumes of structured or unstructured data. 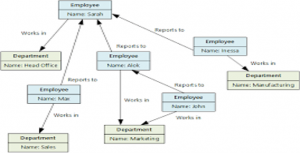 Non-relational databases show data vertically, combined rather than in structured tables.
NoSQL databases allow greater flexibility for storing ever-changing data and new data types but getting to the specific data that is useful is more difficult. Most companies use both relational and non-relational databases to store data. Data often resides in multiple sources with different data formats. Thus, there is a need for data storage architecture.
The video below explains the difference between the relational and non-relational databases in a lot more detail.
Data Storage Architecture
Data storage architecture provides a framework for companies to systematically organize, understand, and use them to make both small and large decisions. Recently the trend has evolved in data architecture where companies are investing in flexible cloud infrastructure and open-source architecture.
In theory, data analytics can be applied to analyze any kind of information repository this includes CRM Enterprise Resource Planning and other Online Transaction Processing (OLTP) software that supports operational data transactions such as customer order entry financial processing material ordering shipping process and customer service all in real-time. Potato storage in learning different sources of data internal company data can be combined with data from other sources such as social media IE YouTube Facebook Instagram to capture customer opinions about products reviews and video comments which also can be combined with website web sales data. Streaming data and continuous transfer of data from numerous sources in different formats could also be included to capture customer data this might include geographic mobile data sensor data from physical stores and logs from internal systems and web captures of the tip of type content in time of transactions made by the user interacting with the system.
Data Storage
A data warehouse contains historical data from various databases throughout a company and provides a structural environment for high speed a data warehouse contains consists of data from different functional areas of an organization. A data mart is a subset of a data warehouse that provides a specific value to a group of users. A data lake is a storage of repository that holds a large amount of data in its native format. Data management as a process is the lifecycle management of data from acquisition to disposal. Add data management provides a stable solution that facilitates efficient data access to appropriate people that reside both internally such as the marketing team and externally such as suppliers to the company. Company data often consists of diverse data sources. A challenge to today’s data management is the inbound data continues to increase exponentially and this data must be cleaned, verified, and validated so that it can be used in the future as high-quality data.
Data Quality
Customers or employees can easily input incorrect data by typing an incorrect zip code using an invalid e-mail address, in the spelling of a name, or by putting a decimal in the wrong location. This becomes an issue when the company decides to identify high-value customers based on purchase history. This customer would likely be limited because the transactions are divided into several customer names and subsequently smaller purchase amounts. Lack of quality data can also result in consequences to a company employee because crucial decisions are based upon data that is available to them in the system. For data records to be valuable if they must be timely, accurate, complete, and consistent. Many times unsatisfied customers are a result of poor data quality.
Timeliness: real-time data such as customer social media sentiment responses to a marketing campaign online and offline customer behavior patterns customer service chatbots or cut all sinners are all crucial in making crucial decisions.
Completeness: Data completeness means maintaining the sufficient breadth, depth, and scope for a particular task.
Accuracy: Data accuracy is the extent to which the data is error-free. If the data is correct, reliable, and accurately measured.
Consistency: Data inconsistencies can lead to embarrassing dilemmas and uncoordinated strategic decision-making.
Format: Format is the extent to which the information is adequately presented or delivered for efficient and effective understanding. If the dashboard is difficult to read or clumsy to navigate the impact could be detrimental.
Data Preparation
Data is messy and must be tidied up before being used. Expensive use of descriptive statistics and data visualization methods is necessary to gain an understanding of the data. First, the data must properly be prepared. In most data analytics projects, the analyst will have access to ample data to analyze a model. For this reason, it is important to pay close attention to the variables AKA features or predictors included in the model. Keeping too many variables can be unnecessary to achieve good model results and is costly to manage.
As with feature selection, the sample size is an important consideration. In a data mining project with a large dataset, the goal typically is not to estimate the effect size but to produce new records.
A unit analysis describes the what, when, and who of the analysis. At times the unit analysis may not be obvious. There it is a good proact to collaborate with other subject matter experts to collectively determine the correct unit of analysis.
It is common to have missing records for one or more of the variables in the data set.
There are several options to address missing data:
- Imputing missing values with estimated new values (mean, median, regression value)
- Omitting the records with missing values
- Excluding the variables with missing values.
Values that are at a considerable distance from any of the other data clusters are considered outliers. More of the time, outliers need to be removed from the model as noise. In some applications such as fraud detection, however, these rare outlier events are what the model is trying to predict.
Data Transformation
Once data has been cleaned, the marketing analyst should determine whether the data warrants further transformation through aggregation, normalization, new variable construction, or dummy coding.
Aggression during this process summary operations are applied to the data.
Normalization variables also known as (features or predictors) may include different data ranges that vary greatly from each.
New column (feature) construction a new feature predictor or variable can be calculated based on other existing values.
Dummy coding the process can be used when considering normal characters character goal that variables.
