Module 1: Reading and Videos Part 1

Overview:
Marketing Analytics plays a critical role in our daily lives as consumers, from suggesting songs for our playlist, the prices quoted to us on airline tickets, to Alexa letting us know what we should wear today. However, this class will focus on marketing analytics from a business point of view, which impacts customers. In this module we will:
- Define what is meant by marketing analytics in a digital marketing context?
- Discuss how to apply principles of marketing analytics to identify the right business problem.
- Identify types of data sources
- Explain types of data
- Define data measurement types and give examples.
- Understand the difference between predictors and target variables.
- Compare and contrast supervised and unsupervised modeling.
What are Marketing Analytics?
Marketing analytics is the discipline of business data that relates to all areas of marketing it measures the success the success of marketing campaigns optimizes a company sales effort and allows the company to be more specific with all the 4PS of marketing.
The use of data has exploded in recent years and has grown into a multibillion-dollar industry utilizing powerful tools within every level of an organization. These specific tools measure every marketing channel, from email to social media to advertising. Companies use data increasingly for decision making, impacting budgets, product design, and sales efforts. As digital marketing grows, so does its data analytics.
Traditional marketing channels continue to offer rich sources of data themselves combining a range of data sources leads to better decisions greater confidence and results is often connect connected with wide ranging data collection efforts rather than sporadic efforts at information collection for some companies so much data is valid available that it leads to analysis paralysis it is important for an analysts to collect data with a specific purpose analyze data for insights percent cleared data clearly.
The following YouTube talks about two careers within Marketing. This video helps describe the role of a “Marketing Data Scientist”
Principles of marketing analytics to identify the right business problem
As you start your journey of learning, there are fundamental core concepts that have an important impact on the results of the marketing analytics strategies:
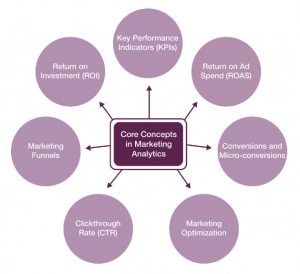
Return on Investment (ROI). We have heard the term, but what does it mean? ROI is the percentage of return an organization sees from its investment in activity such as marketing. Although most examples provided focus on for-profit companies; nonprofits play a critical role within our economy. In a nonprofit measuring ROI has the same goals as it does in the private sector; ensuring that every dollar spent on marketing drives impact. Thus, while the goal of measuring results is often the same, the types of results measured vary.
Key Performance Indicators (KPI) are any value that indicates the performance of an organization or activity. An example is sales. The volume of sales indicates the potential revenue of the business, the speed of growth, and the size of the market. A KPI is not a number; it is the thing the numbers will measure.
Return on ad spend (ROAS) A calculation of the amount of revenue generated by sales that are attributable to advertising, divided by the cost of the advertising.
(Revenue from ads –cost of ads)/cost of ads.
ROAS gives a big-picture overview of how effective advertising is, overall, in driving revenue growth and is meant to measure the value of a company’s total investment in advertising.
Conversion is “Any desired action by which a member of an organization’s target audience helps further the goal of the organization.
Marketing funnel is the series or steps which a member of the public becomes a brand’s customer. Watch the following videos which show the marketing funnel explained and then go through Discussion #2 or In-Class Activity #2.
Market Optimization is the science of marking activities as effective as possible at driving conversions.
Click-Through Rate (CTR) is the percentage of users exposed to a message who then choose to click on a message. The click-through rate is an important leading indicator of consumer behavior and can be used to measure clicks on an ad, on links in an email, or even on a website itself. CTR alone is a limited measure of marketing success, why?
CTR is the number of clicks your ad receives/the number of times your ad is shown (impressions) X 100
The video below helps describe what is CTR.
Data Sources
Now it is time to focus on the different data sources. The following video gives a big picture overview on how businesses use data sources.
Along with the video above it will be important to know the differences between primary and secondary data. Primary data collected for a specific purpose. Companies conduct surveys focus groups, interviews, observations, and experiments to address problems or answer distinct questions. In contrast, secondary data relies on existing data that has already been collected for another purpose. This type of data can be useful in formulation ideas on which questions to ask are the right questions or to design future data collection.
Types of Data
Data is facts and figures collected, organized, and presented for analysis and interpretation. Data is available in two main forms: structured and unstructured.
Structured Data: made up of records that are organized in rows and columns. This type of data is stored in a database or spreadsheet format. It includes numbers, dates, and text. The data is easy to access and analyze using descriptive, predictive, prescriptive, and AI (Artificial Intelligence) data analytics techniques.
Unstructured Data: includes text, images, videos, and sensor data. The data does not have a predefined structure and does not fit well into a table format with rows and columns. When possible, unstructured data is converted into structured format prior to analysis. The number of companies collecting unstructured data has increased dramatically as technology has advanced to efficiently support manipulation and exploration of this type of data.
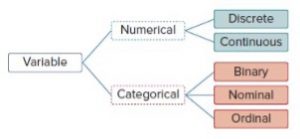
Data Measurement
Numerical data can be discrete (integer) or continuous.
|
Categorical data exists when values are selected from categories.
|
Predictors versus Target Variable
Variables are characteristics of features that pertain to a person, place, or object. Market analysts explore relationships between variables to improve decision making.
Does the economy impact college enrollment numbers?
- Economic conditions are independent variables.
- It influences or drives the dependent, target, or outcome variable which are the enrollment numbers.
Modeling Types: Supervised or Unsupervised Learning
Supervised learning suggests the target variable is known.
If the target variable is continuous, results are a prediction. If categorical, supervised learning is called a classification. |
Unsupervised learning has no previously defined target variable.
This technique may include:
|
