71 9.2 The Temperature of Earth’s Interior — Physical Geology – 2nd Edition
9.2 The Temperature of Earth’s Interior
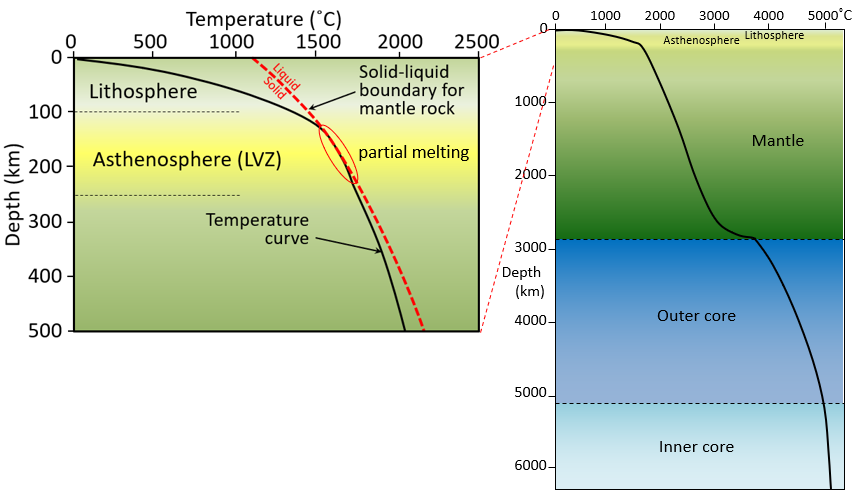
As we’ve discussed in the context of metamorphism, Earth’s internal temperature increases with depth. However, as shown in Figure 9.2.1 (right), that rate of increase is not linear. The temperature gradient is around 15° to 30°C per kilometer within the upper 100 kilometers; it then drops off dramatically through the mantle, increases more quickly at the base of the mantle, and then increases slowly through the core. The temperature is around 1000°C at the base of the crust, around 3500°C at the base of the mantle, and around 5,000°C at Earth’s center. The temperature gradient within the lithosphere (upper 100 kilometers) is quite variable depending on the tectonic setting. Gradients are lowest in the central parts of continents, higher in the vicinity of subduction zones, and higher still at divergent boundaries.

Figure 9.2.1 (left) shows a typical temperature curve for the upper 500 kilometers of the mantle in more detail, along with the melting curve for dry mantle rock. (Mantle rock will melt under conditions to the right of the dashed red line.) In general the mantle is not molten because the temperature lies to the left of the melting curve, but within the depth interval between 100 and 250 kilometers the temperature curve comes very close to the melting boundary for dry mantle rock. At these depths, therefore, mantle rock is either very nearly melted or partially melted. In some situations, where extra heat is present and the temperature line crosses over the melting line, or where water is present, it may be completely molten. This region of the mantle—the asthenosphere—is also known as the low-velocity zone because seismic waves are slowed within rock that is near its melting point. Below 250 kilometers the temperature stays on the left side of the melting line; in other words, the mantle is solid from here all the way down to the D” layer near the core-mantle-boundary.
The fact that the temperature gradient is much less in the main part of the mantle than in the lithosphere has been interpreted to indicate that the mantle is convecting, and therefore that heat from depth is being brought toward the surface faster than it would be with only heat conduction. As we’ll see in Chapter 10, a convecting mantle is an key feature of plate tectonics.
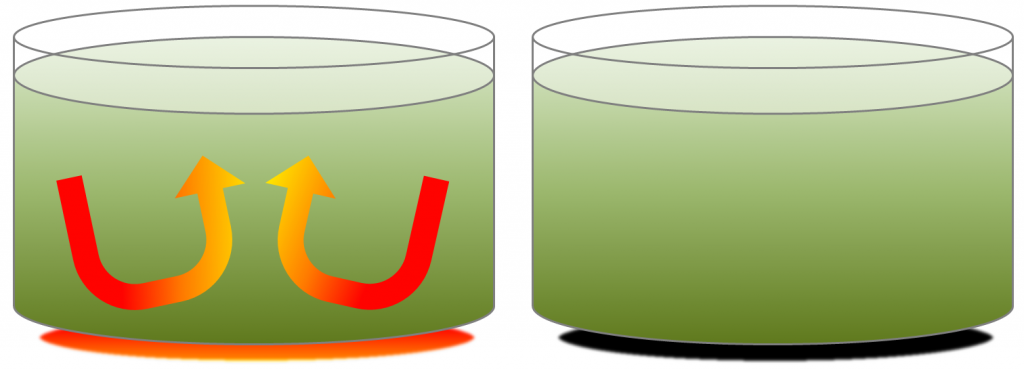
The convection of the mantle is a product of the upward transfer of heat from the core to the lower mantle. As in a pot of soup on a hot stove (Figure 9.2.2), the material near the heat source becomes hot and expands, making it lighter than the material above. The force of buoyancy causes it to rise, and cooler material flows in from the sides. The mantle convects in this way because the heat transfer from below is not perfectly even, and also because, even though mantle material is solid rock, it is sufficiently plastic to slowly flow (at rates of centimeters per year) as long as a steady force is applied to it.
As in the soup pot example, Earth’s mantle will no longer convect once the core has cooled to the point where there is not enough heat transfer to overcome the strength of the rock. This has already happened on smaller planets like Mercury and Mars, as well as on Earth’s Moon.

The heat of Earth’s interior comes from two main sources, each contributing about 50% of the heat. One of those is the frictional heat left over from the collisions of large and small particles that created Earth in the first place, plus the subsequent frictional heat of redistribution of material within Earth by gravitational forces (e.g., sinking of iron to form the core).
The other source is radioactivity, specifically the spontaneous radioactive decay of the isotopes 235U, 238U, 40K, and 232Th, which are primarily present in the mantle. As shown on Figure 9.2.3, the total heat produced that way has been decreasing over time (because these isotopes are getting used up), and is now roughly 25% of what it was when Earth formed. This means that Earth’s interior is slowly becoming cooler.
Image Descriptions
Media Attributions
- Figures 9.1.1, 9.1.2: © Steven Earle. CC BY.
- Figure 9.1.3: © Steven Earle. CC BY. Based on R. Arevalo, W. McDonough, M. Luong, , The K/U ratio of Earth: insights into mantle composition, structure and thermal evolution, Earth and Planetary Science Letters, V 278, p. 361-369, 2009.

