135 19.3 Implications of Climate Change — Physical Geology – 2nd Edition
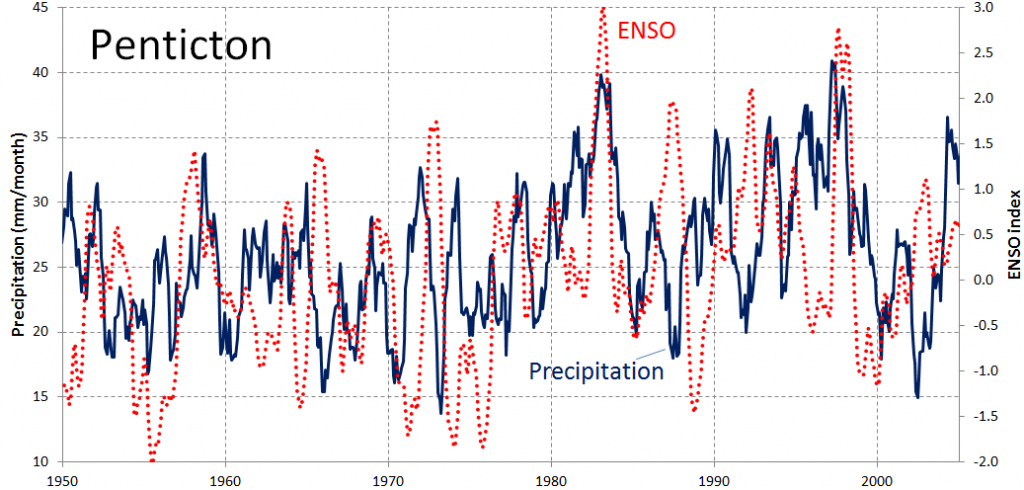
Figure 19.3.6 shows the monthly precipitation data for Penticton, BC from 1950 to 2005 (solid line) along with the ENSO (El Niño Southern Oscillation) index values (dotted line). High ENSO index values correspond to strong El Niño events, such as 1983 and 1998. Describe the relationship between ENSO and precipitation in B.C.’s southern interior.
It’s not necessarily a consistent relationship.
See Appendix 3 for Exercise 19.4 answers.
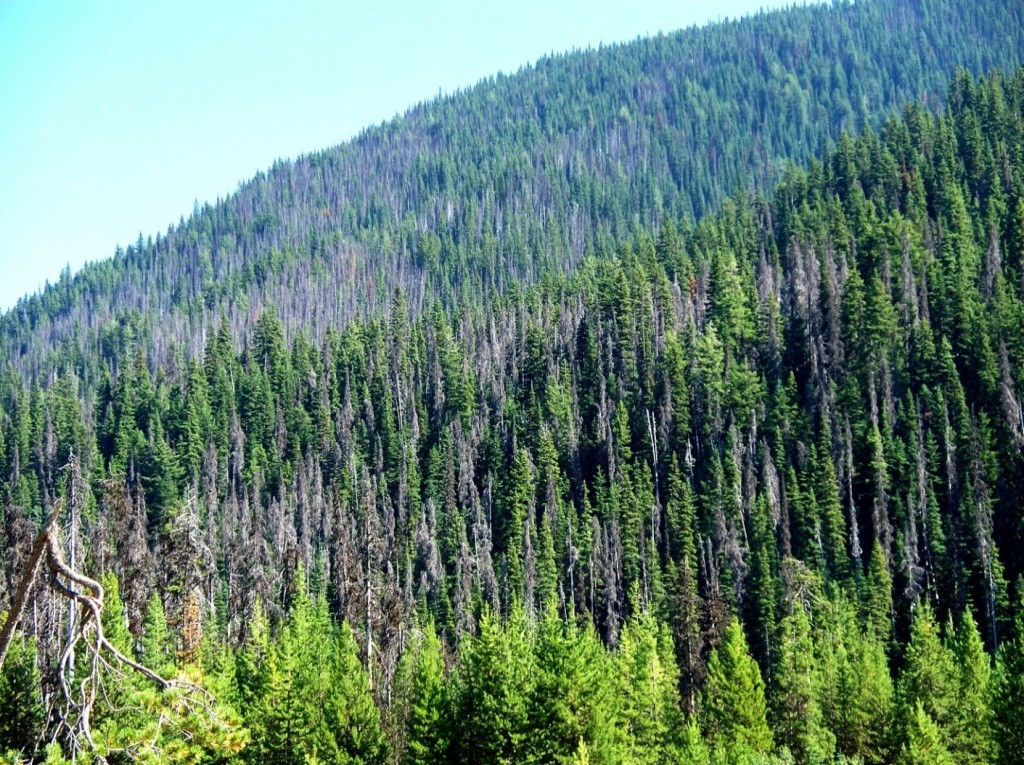
The geographical ranges of diseases and pests, especially those caused or transmitted by insects, have been shown to extend toward temperate regions because of climate change. West Nile virus and Lyme disease are two examples that already directly affect Canadians, while dengue fever could be an issue in the future. Canadians are also indirectly affected by the increase in populations of pests such as the mountain pine beetle (Figure 19.3.7).
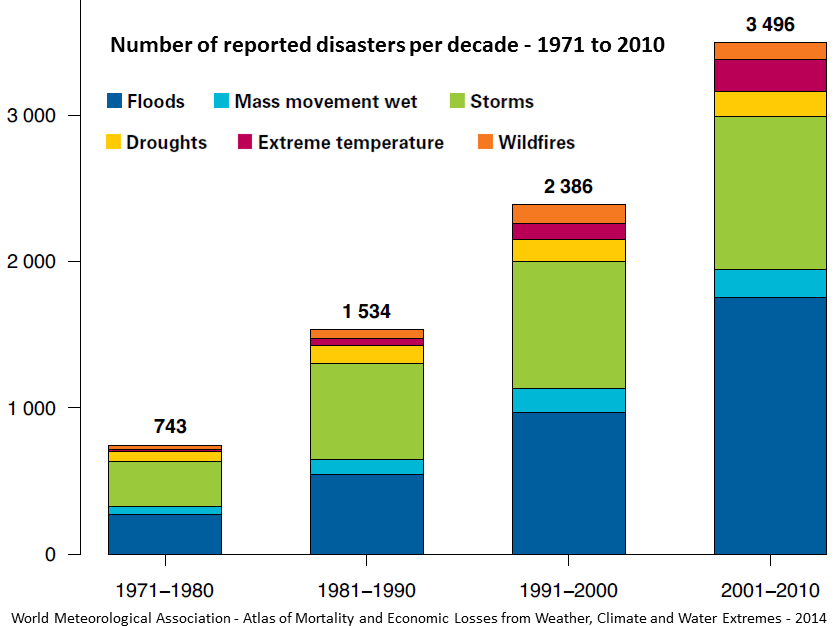
A summary of the impacts of climate change on natural disasters is given in Figure 19.3.8. The major types of disasters related to climate are floods and storms, but the health implications of extreme temperatures are also becoming a great concern. In the decade 1971 to 1980, extreme temperatures were the fifth most common natural disasters; by 2001 to 2010, they were the third most common.
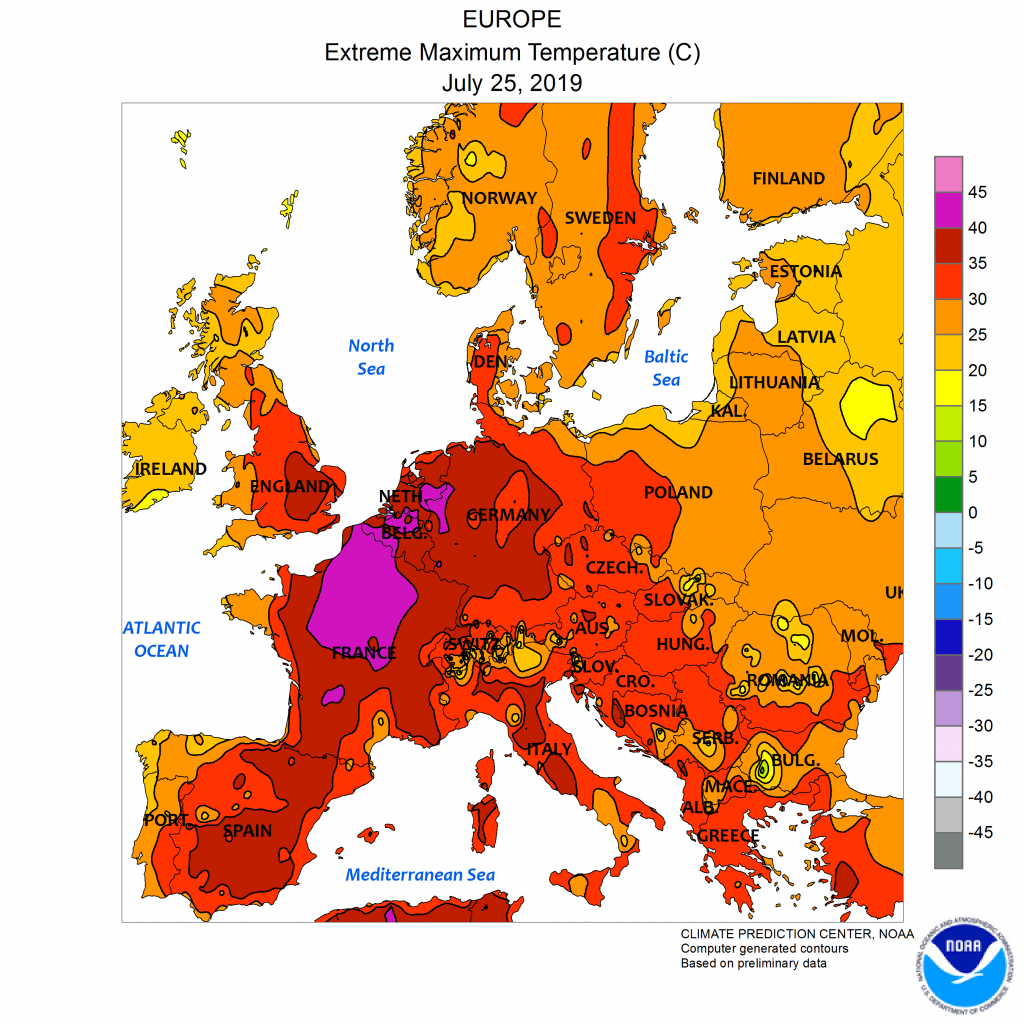
For several days in both June and July of 2019, many parts of Europe experienced massive heat waves with all-time national record temperatures set in several countries (Belgium, Finland, France, Germany, Luxembourg, Netherlands, and United Kingdom) (Figure 19.3.9). At the time of writing (August 2019) the death toll from these events is not known. A similar event in Russia in 2010 is estimated to have resulted in over 55,000 deaths.
If you look back to Figure 19.2.3 and the related text, you can easily see what aspects of our way of life are the most responsible for climate change. Think about how you could make changes to your own lifestyle to reduce your impact on the climate. It may depend on where you live, and the degree to which fossil fuels are used to generate the electricity that you use, but it’s most likely to include how, how far, how fast, and how frequently you move around.
If you hold the opinion that there isn’t much point in making changes to your lifestyle because others won’t or because your contribution is only a tiny fraction of the problem, bear in mind that all of us have the opportunity to set an example that others can follow. And remember the words of the American anthropologist Margaret Mead:
Never doubt that a small group of thoughtful, committed citizens can change the world. Indeed, it is the only thing that ever has.
Image Descriptions
| Negative 12% to 0% | 0% to 12% | 12% to 24% | 24% to 36% | 26% to 48% | Greater than 48% |
|---|---|---|---|---|---|
|
|
|
|
|
|
[Return to Figure 19.3.5]
Figure 19.3.8 image description: From the 1970s, the number of reported disasters by decade has grown steadily. In the 1970s, 743 disasters were reported; in the 1980s, 1,534 were reported; in the 1990s, 2,386 were reported, and in the 2000s, 3,496 were reported. Together, floods and storms make up about three quarters of the reported disasters each decade, followed by mass movement wet, droughts, extreme temperature, and wildfires. [Return to Figure 19.3.8]
Media Attributions
- Figure 19.3.1: “Past and Projected Changes in Global Sea Level Rise” based on data from Parris et al. 2012 with input from NASA Jet Propulsion Laboratory. Adapted by Steven Earle. Public domain.
- Figure 19.3.2: “Hurricane Sandy New Jersey Pier” © Master Sgt. Mark C. Olsen/U.S. Air Force/New Jersey National Guard. CC BY.
- Figure 19.3.3: “Atlantic sea-surface T vs. tropical storm power” © Steven Earle. CC BY. Based on data from Papers, Data, and Graphics Pertaining to Tropical Cyclone Trends and Variability.
- Figure 19.3.4: “Precipitation Worldwide, 1901-2013” by NASA. Public domain.
- Figure 19.3.5: © Steven Earle. CC BY. Based on data from Environment Canada.
- Figure 19.3.6: © Steven Earle. CC BY. Based on precipitation data from Environment Canada and ENSO data.
- Figure 19.3.7: “Pine Beetle in Manning Park” © Jonhall. CC BY.
- Figure 19.3.8: WMO Atlas of Mortality and Economic Losses from Weather, Climate and Water Extremes, 2014. CC BY-NC-ND.
- Figure 19.3.9: “Heatwave in Russia” by Jesse Allen/NASA Earth Observatory. Public domain.
<!– pb_fixme –>
<!– pb_fixme –>
