103 14.1 Groundwater and Aquifers — Physical Geology – 2nd Edition
14.1 Groundwater and Aquifers
Groundwater is stored in the open spaces within rocks and within unconsolidated sediments. Rocks and sediments near the surface are under less pressure than those at significant depth and therefore tend to have more open space. For this reason, and because it’s expensive to drill deep wells, most of the groundwater that is accessed by individual users is within the first 100 meters of the surface. Some municipal, agricultural, and industrial groundwater users get their water from greater depth, but deeper groundwater tends to be of lower quality than shallow groundwater, so there is a limit as to how deep we can go.
is the percentage of open space within an unconsolidated sediment or a rock. Primary porosity is represented by the spaces between grains in a sediment or sedimentary rock. Secondary porosity is porosity that has developed after the rock has formed. It can include fracture porosity—space within fractures in any kind of rock. Some volcanic rock has a special type of porosity related to vesicles, and some limestone has extra porosity related to cavities within fossils.
Porosity is expressed as a percentage calculated from the volume of open space in a rock compared with the total volume of rock. The typical ranges in porosity of a number of different geological materials are shown in Figure 14.1.1. Unconsolidated sediments tend to have higher porosity than consolidated ones because they have no cement, and most have not been strongly compressed. Finer-grained materials (e.g., silt and clay) tend to have greater porosity—some as high as 70%—than coarser materials (e.g., gravel). Primary porosity tends to be higher in well-sorted sediments compared to poorly sorted sediments, where there is a range of smaller particles to fill the spaces made by the larger particles. Glacial till, which has a wide range of grain sizes and is typically formed under compression beneath glacial ice, has relatively low porosity.
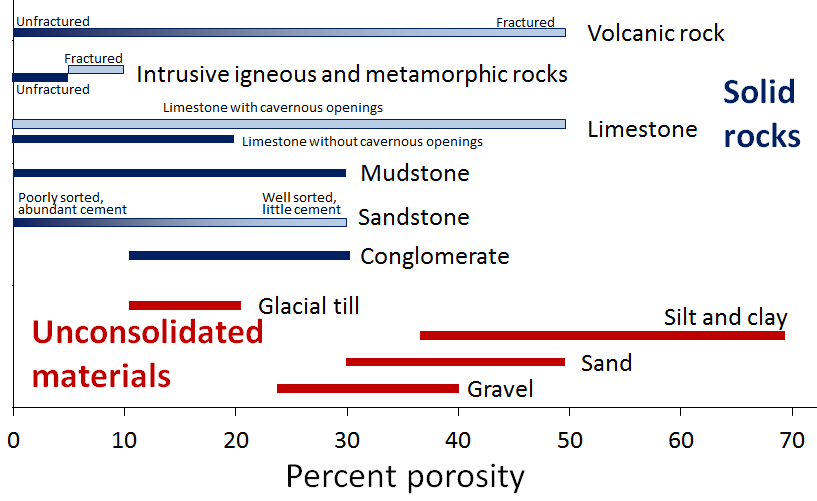
Consolidation and cementation during the process of lithification of unconsolidated sediments into sedimentary rocks reduces primary porosity. Sedimentary rocks generally have porosities in the range of 10% to 30%, some of which may be secondary (fracture) porosity. The grain size, sorting, compaction, and degree of cementation of the rocks all influence primary porosity. For example, poorly sorted and well-cemented sandstone and well-compressed mudstone can have very low porosity. Igneous or metamorphic rocks have the lowest primary porosity because they commonly form at depth and have interlocking crystals. Most of their porosity comes in the form of secondary porosity in fractures. Of the consolidated rocks, well-fractured volcanic rocks and limestone that has cavernous openings produced by dissolution have the highest potential porosity, while intrusive igneous and metamorphic rocks, which formed under great pressure, have the lowest.
Porosity is a measure of how much water can be stored in geological materials. Almost all rocks contain some porosity and therefore contain groundwater. Groundwater is found under your feet and everywhere on the planet. Considering that sedimentary rocks and unconsolidated sediments cover about 75% of the continental crust with an average thickness of a few hundred meters, and that they are likely to have around 20% porosity on average, it is easy to see that a huge volume of water can be stored in the ground.
Porosity is a description of how much space there could be to hold water under the ground, while permeability describes how those pores are shaped and interconnected. This determines how easy it is for water to flow from one pore to the next. Larger pores mean there is less friction between flowing water and the sides of the pores. Smaller pores mean more friction along pore walls, and also more twists and turns for the water to have to flow-through. A permeable material has a greater number of larger, well-connected pores spaces, whereas an impermeable material has fewer, smaller pores that are poorly connected. Permeability is the most important variable in groundwater. Permeability describes how easily water can flow through the rock or unconsolidated sediment and how easy it will be to extract the water for our purposes. The characteristic of permeability of a geological material is quantified by geoscientists and engineers using a number of different units, but the most common is the hydraulic conductivity. The symbol used for hydraulic conductivity is K. Although hydraulic conductivity can be expressed in a range of different units, in this book we will always use meters per second.
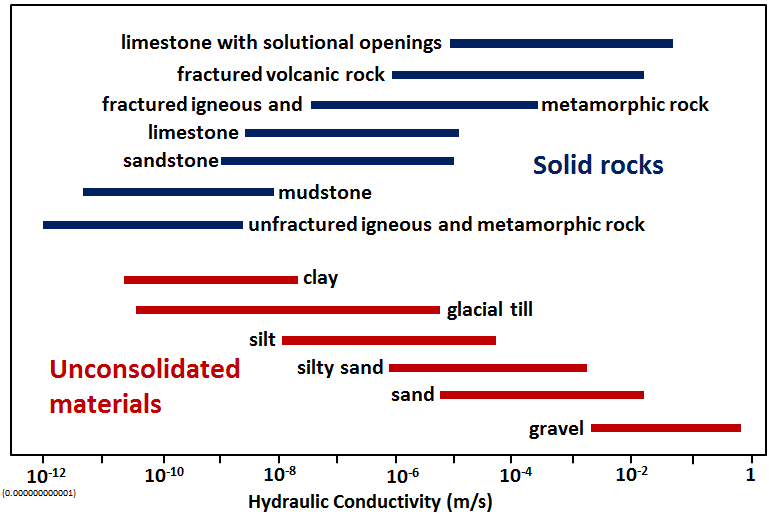
As shown on Figure 14.1.2 there is a wide range of permeability in geological materials from 10−12 meters per second (0.000000000001 meters per second) to around 1 meter per second. Unconsolidated materials are generally more permeable than the corresponding rocks (compare sand with sandstone, for example), and the coarser materials are much more permeable than the finer ones. The least permeable rocks are unfractured intrusive igneous and metamorphic rocks, followed by unfractured mudstone, sandstone, and limestone. The permeability of sandstone can vary widely depending on the degree of sorting and the amount of cement that is present. Fractured igneous and metamorphic rocks, and especially fractured volcanic rocks, can be highly permeable, as can limestone that has been dissolved along fractures and bedding planes to create solution openings.
Both sand and clay deposits (and sandstone and mudstone) are quite porous (30% to 50% for sand and 40% to 70% for silt and clay), but while sand can be quite permeable, clay and mudstone are not.
The surface of most silicate mineral grains has a slight negative charge due to imperfections in the mineral structure. Water (H2O) is a polar molecule. This means that while it has no overall electrical charge, one side of the molecule has a slight positive charge (the side with the two hydrogens), compared to a slight negative charge on the other side. Water is strongly attracted to all mineral grains and water within that bound water layer (a few microns around each grain) is not able to move and flow along with the rest of the groundwater.
In the two diagrams of Figure 14.1.3 the bound water is represented by medium blue lines around each grain, and the water that is not bound, and can flow, is shown in light blue. In the sand, there is still a lot of water that is able to move through the sediment, but in the clay deposit almost all of the water is held tightly to the grains and this reduces the permeability.
We have now seen that there is a wide range of porosity in geological materials and an even wider range of permeability. Groundwater exists everywhere there is porosity. However, whether that groundwater is able to flow in significant quantities depends on the permeability. An aquifer is defined as a body of rock or unconsolidated sediment that has sufficient permeability to allow water to flow through it. Unconsolidated materials like gravel, sand, and even silt make relatively good aquifers, as do rocks like sandstone. Other rocks can be good aquifers if they are well fractured. An aquitard is a body that does not allow transmission of a significant amount of water, such as a clay, a till, or a poorly fractured igneous or metamorphic rock. These are relative terms, not absolute, and are usually defined based on someone’s desire to pump groundwater; what is an aquifer to someone who does not need a lot of water, may be an aquitard to someone else who does. An aquifer that is exposed at the ground surface is called an unconfined aquifer. An aquifer where there is a lower permeability material between the aquifer and the ground surface is known as a confined aquifer, and the aquitard separating ground surface and the aquifer is known as the confining layer.
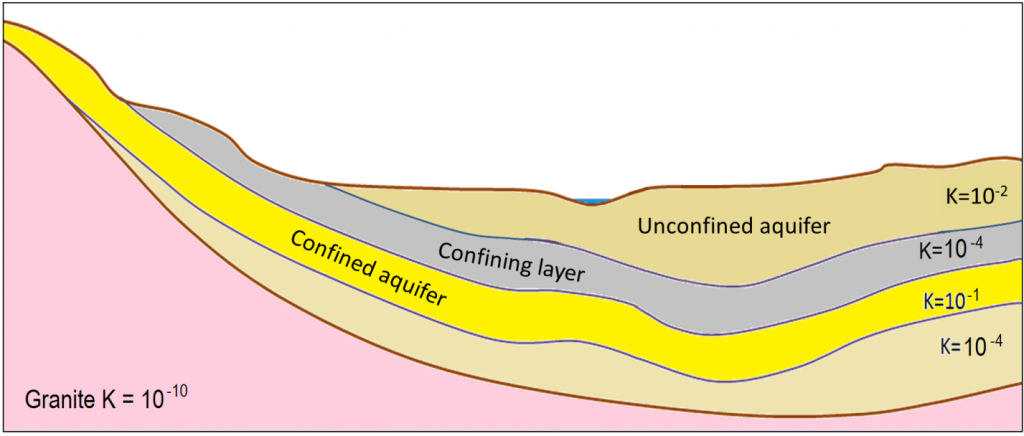
Figure 14.1.4 shows a cross-section of a series of rocks and unconsolidated materials, some of which might serve as aquifers and others as aquitards or confining layers. The granite is much less permeable than the other materials, and so is an aquitard in this context. The yellow layer is very permeable and would make an ideal aquifer. The overlying grey layer is a confining layer.
The upper buff-colored layer (K = 10−2 meters per second) does not have a confining layer and is an unconfined aquifer. The yellow layer (K = 10-1 meters per second) is “confined” by the confining layer (K = 10−4 meters per second), and is a confined aquifer. The confined aquifer gets most of its water from the upper part of the hill where it is exposed at the surface, and relatively little by seepage through the fine silt layer.
Image Descriptions
| Unconsolidated Materials | Percent porosity |
|---|---|
| Glacial Till | 11% to 20% |
| Silt and clay | 36% to 70% |
| Sand | 30% to 50% |
| Gravel | 24% to 40% |
| Material Type | Hydraulic conductivity (metres per second) |
|---|---|
| Clay | 10 to the power of negative 10.6 to 10 to the power of negative 7.7 (10−10.6 to 10−7.7) |
| Glacial till | 10 to the power of negative 10.4 to 10 to the power of negative 5.2 (10−10.4 to 10−5.2) |
| Silt | 10 to the power of negative 8 to 10 to the power of negative 4.3 (10−8 to 10−4.3) |
| Silty sand | 10 to the power of negative 6 to 10 to the power of negative 2.7 (10−6 to 10−2.7) |
| Sand | 10 to the power of negative 5.2 to 10 to the power of negative 1.7 (10−5.2 to 10−1.7) |
| Gravel | 10 to the power of negative 2.7 to 10 to the power of negative 0.1 (10−2.7 to 10−0.1) |
Figure 14.1.4 image description: The relative permeability of various sedimentary layers. Permeability is denoted by hydraulic conductivity (K = meters per second). The buff-colored, top layer is an unconfined aquifer with K = 10−2. The grey-colored second layer is a confining layer with K = 10−4. The yellow-colored third layer is a confined aquifer with K = 10−1. The fourth layer is unlabeled, with K = 10−4. The bottom layer is granite, K = 10−10. [Return to Figure 14.1.4]
Aquifers of the Denver Area
Figure 14.1.5. shows a diagram similar to that of Figure 14.1.4. but highlights the multiple sedimentary layers that underlie much of the Metro Denver area. In total, there are four major aquifers that supply or could potentially supply the metropolitan Denver region, and beyond. The confining units are typically shales, with the Pierre Shale being the bottommost of these aquicludes.. The aquifers are recharged starting in the high mountains with precipitation and snowmelt percolating into the subsurface from the west. As the folded aquifers slope eastward, the flow of groundwater follows suit. Due to their high thicknesses and proximity to the surface, the Dawson and Denver aquifers are the most important that supply the Denver metropolitan area. The Dawson Formation consists primarily of white arkose sandstone with a hydraulic conductivity ranging from 20-50 gallons per square foot (gal/ft2), with the Denver Formation (dominantly sands and silts with some clay with a maximum thickness of around 475 m) having a conductivity range of 10-20 gal/ft2. As seen in Figure 14.1.5., the Dawson aquifer supplies most of Denver proper, whereas the Denver aquifer flanks the city underlying most of the suburbs. The Arapahoe Formation (alluvial fan and river deposits), of median depth, has a conductivity range roughly equivalent that of the Dawson Arkose, and is roughly 300 m at its thickest. The deepest aquifer is a combination of the Laramie and Fox Hills Formations (consisting dominantly of sandstones and shales/mudstones) with a thickness range of 275-625 ft., and a conductivity range of 2-35 gal/ft2.

Figure 14.1.5. A cross-section of the Denver Basin highlighting important aquifers as well as aquicludes. The Dawson and Denver Formations are the most important aquifers in the Denver Metropolitan area given their proximity to the surface, thickness, high hydraulic conductivity values and their vast spatial extent (see Figure 14.1.6. below).

Figure 14.1.6. Aerial (map) view of the spatial extent of the Denver Basin aquifers and which communities tap from which aquifer.
Media Attributions
- Figure 14.1.1, 14.1.2, 14.1.3, 14.1.4: © Steven Earle. CC BY.
- Figure 14.1.5.: United States Geological Survey, Public Domain (originally created by Mark Paschke)
- Figure 14.1.6.: Colorado Division of Water Resources, Public Domain
