9 Lesson 5 Bonds
When an investor purchases a bond, that person is, for all intents and purposes, making a loan to the bond issuer. Bonds issues are used to raise funds and can be issued by corporations, governments, or even subagencies of governments (including local municipalities).
As with any type of loan, the borrowing party is expected to offer something to the lender in exchange for their time and trouble. In this case, the bond-issuing entity will agree not only to repay the original face value of the loan on a specific date (the maturity of the bond) but also to pay the lender interest—or, in bond terminology, coupon payments.
Coupon payments are designed to make a bond purchase more acceptable for investors by helping compensate them for the time value of money. Because investors are parting with money that they have right now in order to make the initial bond purchase but will not see repayment of principal until the maturity date of the bond, they will experience the negative impact of time value over the bond term. When a bond issuer offers periodic coupon payments, this helps offset the negative effect of the delayed receipt of the principal amount for the investor. Also, because coupon payments will be coming to the investor throughout the term of the bond, essentially in installment payments (an annuity), the time value of money plays a critical role in bond transactions and in calculating bond valuation.
Bonds, along with stocks and mutual funds, are considered to be one of the most basic financial instruments available to any investor. It is quite common for investors to round out their portfolios by purchasing bonds,
adding a degree of safety and diversity to their investment mix.
 10.1
10.1
Characteristics of Bonds
Learning Outcomes
By the end of this section, you will be able to:
- List and define the basic characteristics of bonds.
- List and describe the various types of bonds available.
- Explain how a bond price is inversely related to its return (yield).
Bonds as Investments
One way to look at bond investments is to consider the fact that any investor who purchases a bond is essentially buying a future cash flow stream that the bond issuer (or borrower) promises to make as per agreement.
Because bonds provide a set amount of cash inflow to their owners, they are often called fixed-income securities. Thus, future cash flows from the bond are clearly stated per agreement and fixed when the bond sale is completed.
Bonds are a basic form of investment that typically include a straightforward financial agreement between issuer and purchaser. Nevertheless, the terminology surrounding bonds is unique and rather extensive. Much of the specialized vocabulary surrounding bonds is designed to convey the concept that a bond is similar to other financial instruments in that it is an investment that can be bought and sold. Much of this unique terminology will be covered later in this chapter, but we can set out some of the basics here with an example.
Let’s say that you buy a $1,000 bond that was issued by Apple Inc. at 5% interest, paid annually, for 20 years. Here, you are the lender, and Apple Inc. is the borrower.
LINK TO LEARNINGInformational Basics on BondsHYPERLINK “https://openstax.org/r/the-basics-of-bonds” \hThis video (https://openstax.org/r/the-basics-of-bonds) from MoneyWeek editor Tim Bennett provides information about the basics of bonds—what they are, how they work, why companies and governments issue them, and why investors might buy them.
Basic Terminology
We need to know the following basic bond terms and pricing in order to apply the necessary time value of money equation to value this Apple, Inc. bond issue:
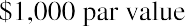
- Par value: A bond will always clearly state its par value, also called face amount or face value. This is equal to the principal amount that the issuer will repay at the end of the bond term or maturity date. In our example, the par value of the bond is $1,000.
- Coupon rate: This is the interest rate that is used to calculate periodic interest, or coupon payments, on the bond. It is important to note that coupon rates are always expressed in annual terms, even if coupon payments are scheduled for different periods of time. The most common periods for coupon payments other than annual are semiannual and quarterly. Coupon rates will typically remain unchanged for the entire life of the bond. In our example, the coupon rate is the 5% interest rate.
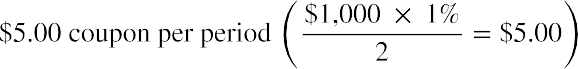
- Coupon payment: This refers to the regular interest payment on the bond. The coupon or periodic interest payment is determined by multiplying the par value of the bond by the coupon rate. It is important to note that no adjustment needs to be made to the coupon rate if the bond pays interest
annually. However, if a bond pays interest on a semiannual or quarterly basis, the coupon rate will have to be divided by 2 or 4, respectively, to convert the stated annual rate to the correct periodic rate. In our example, coupons are paid annually, so the periodic or annual interest that is paid is equal to  . You may notice that because these payments are the same amount and made at regular intervals, they constitute an annuity stream (refer to Time Value of Money II: Equal Multiple Payments.
- Maturity date: The maturity date is the expiration date of the bond, or the point in time when the term of a bond comes to an end. On the maturity date, the issuer will make the final interest or coupon payment on the bond and will also pay off its principal, or face value. In our example, the maturity date is at the end of the 20-year period.
- Yield to maturity (YTM): The YTM is essentially the discount rate used to bring the future cash flows of a bond into present value terms. It also equals the return that the investor will receive if the bond is held to maturity. The YTM helps quantify the overall investment value of a bond. We will explore how to compute this rate later in the chapter.
Table 10.1 displays a selected listing of bonds available for purchase or sale. First, let’s review the columns so you can learn how to read this table.
IssuerBond Type Current Callable? Coupon3M Co.CorpAlteryxCorpAnheuser-Busch Cos. LLCCorpCity of ChicagoMuniCoca-Cola Co.CorpDuPont De Nemours Inc.CorpExxon Mobil Corp.CorpFord Motor Co.CorpNordstrom Inc.CorpTennessee Energy Acquisition Corp.MuniPrice %Rate %105.120Yes2.2598.818No1.00125.319Yes5.95103.164Yes5.0095.206Yes1.00100.815Yes2.17107.325Yes3.18114.880No7.13112.905No6.95102.168No5.25Maturity Date9/19/20268/1/20261/25/20331/1/20333/15/20285/1/20233/15/202411/15/20253/15/20289/1/2021Yield% Rating1.240A+1.206 None3.3401.0301.7311.7750.4833.6234.7580.451BBB+ BBB+ A+ BBB+ AA- BB+ BB+BBB+
Table 10.1 Bond Information, March 2021 (source: FINRA-Markets.Morningstar.com)
- Column 1: Issuer. The first column shows the company, city, or state issuing the bond. This bond listing includes two municipal issuers (City of Chicago and Tennessee Energy) as well as several corporate issuers.
- Column 2: Bond Type. This describes the issue of the bond and indicates whether it is a corporation or a municipality.
- Column 3: Current Price. The third column shows the price as a percent of par value. It is the price someone is willing to pay for the bond in today’s market. We quote the price in relation to $100. For example, the Nordstrom bond is selling for 112.905% of its par value, or $112.905 per $100.00 of par value. If this bond has a $1,000.00 par value, it will sell for
 . Note: Throughout this chapter, we use $1,000 as the par value of a bond because it is the most common par value for corporate bonds.
 - Column 4: Callable? This column states whether or not the bond has a call feature (if it can be retired or ended before its normal maturity date).
- Column 5: Coupon Rate. The fifth column states the coupon rate, or annual interest rate, of each bond.
- Column 6: Maturity Date. This column shows the maturity date of the issue—the date on which the
corporation will pay the final interest installment and repay the principal.
- Column 7: Yield. The seventh column indicates each bond’s yield to maturity—the yield or investment return that you would receive if you purchased the bond today at the price listed in column 3 and held the bond to maturity. We will use the YTM as the discount rate in the bond pricing formula.
- Column 8: Rating. The final column gives the bond rating, a grade that indicates credit quality. As we progress through this chapter, we will examine prices, coupon rates, yields, and bond ratings in more detail
Types of Bonds
There are three primary categories of bonds, though the specifics of these different types of bond can vary depending on their issuer, length until maturity, interest rate, and risk.
Government Bonds
The safest category of bonds are short-term US Treasury bills (T-bills). These investments are considered safe because they have the full backing of the US government and the likelihood of default (nonpayment) is remote. However, T-bills also pay the least interest due to their safety and the economics of risk and return, which state that investors must be compensated for the assumption of risk. As risk increases, so should return on investment. Treasury notes are a form of government security that have maturities ranging from one to 10 years, while Treasury bonds are long-term investments that have maturities of 10 to 30 years from their date of issue.
Savings bonds are debt securities that investors purchase to pay for certain government programs. Essentially, the purchase of a US savings bond involves the buyer loaning money to the government with a guaranteed promise that they will earn back the face value of the bond plus a certain amount of interest in the future. Savings bonds are backed by the US government, meaning that there is virtually no possibility of the buyer losing their investment. For this reason, the return on savings bonds is relatively low compared to other forms of bonds and investments.
LINK TO LEARNINGGovernment BondsReview this introductory video (https://openstax.org/r/treasury-bonds-prices) about government bonds.
Municipal bonds (“munis”) are issued by cities, states, and localities or their agencies. Munis typically will return a little more than Treasury bills while being just a bit riskier.
Corporate Bonds
Corporate bonds are issued by companies. They carry more risk than government bonds because corporations can’t raise taxes to pay for their bond issues. The risk and return of a corporate bond will depend on how creditworthy the company is. The highest-paying and highest-risk corporate bonds are often referred to as non-investment grade or, more commonly, junk bonds.
Corporate bonds that do not make regular coupon payments to their owners are referred to as zero-coupon bonds. These bonds are issued at a deep discount from their par values and will repay the full par value at their maturity date. The difference between what the investor spends on them in original purchase price and the par value paid at maturity will represent the investor’s total dollar value return.
Convertible bonds are similar to other types of corporate bonds but have a feature that allows for their conversion into a predetermined number of common stock shares. The conversion from the bond to stock can be done at certain times during the bond’s life, usually at the discretion of the bondholder.
The Global Bond Market versus the Global Stock Market
Bonds have long been a trusted investment vehicle for many investors. Though the global fixed-income debt market remains considerably larger than the global stock market, this is not an entirely fair comparison. Bond markets include sovereign bonds, or bonds that are issues by governments, while stock markets do not. Some experts believe that a more relevant comparison is between the value of corporate bond markets only (excluding sovereign bonds) and total stock market value.
The chart in Figure 10.2 provides global market value information by category so that we may make our own conclusions about these markets.
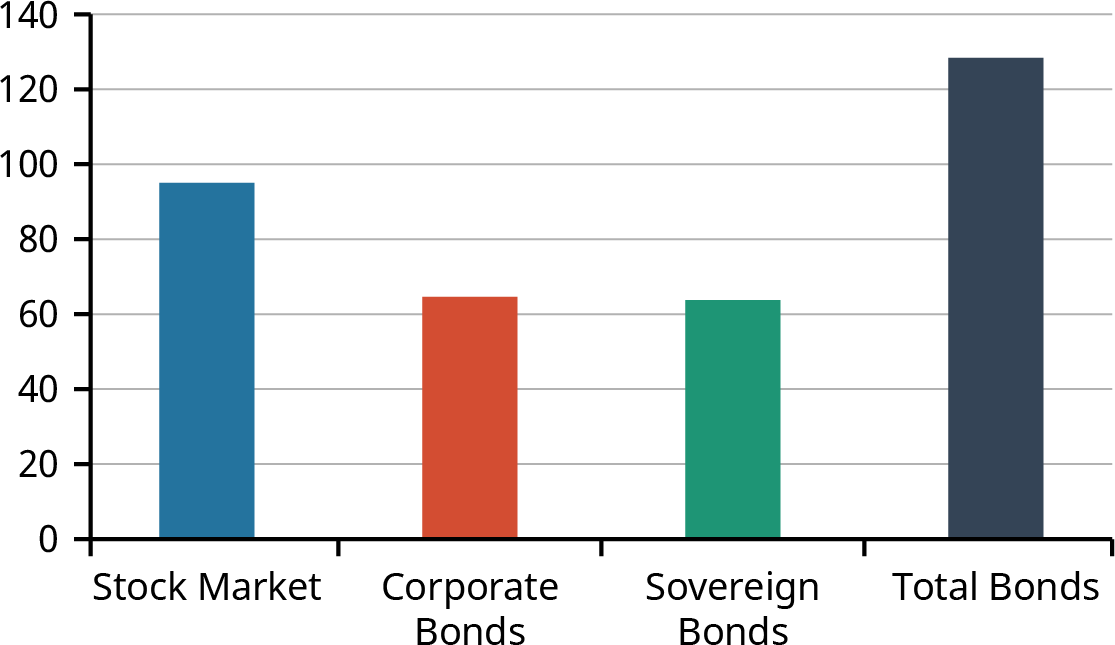
Figure 10.2 Global Bonds versus Stocks: Total Market Values ($Trillions), November 2020 (data source: Nasdaq)
While the total value of bond markets continues to exceed that of stocks, the prevailing trend over the past several years has been that stock markets are gaining in terms of total market size. The primary reason for this is that stocks have traditionally outperformed bonds in terms of return on investment over extended periods of time and are likely to continue to do so. This makes them more attractive to investors, despite the higher risk associated with stock.
The Two Sides of a Bond Investment
There are essentially two sides to a bond investment, meaning the bondholder will receive two types of cash inflow from the bond investment over its term. These are the payment of the par value at maturity (often referred to as payment of the face value of the bond at term end), and the periodic coupon payments (also called interest income) from the bond. These coupon payments are contractually determined and clearly indicated in the bond issue documentation received by the bondholder upon purchase.
As a result of these two types of inflow, bond valuation requires two different time value of money techniques—specifically, present value calculations—to be computed separately and then added together.
The Relationship between Bond Prices and Interest Rates
Bond price and interest rate have an inverse relationship. When interest rates fall, bond prices rise, and vice versa (see Figure 10.3). If interest rates increase, the value of bonds sold at lower interest rates will decline. Similarly, if interest rates decline, the value of fixed-rate bonds will increase. An exception to this general rule is floating-rate bonds (often referred to as “floaters,” floating-rate notes, or FRNs).
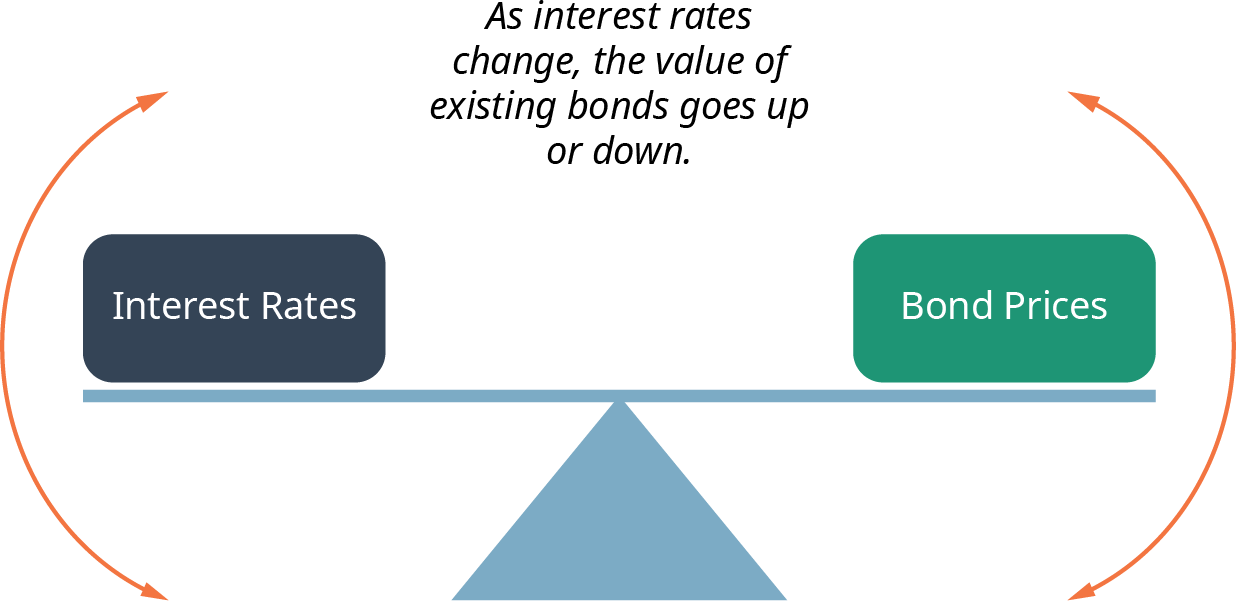
Figure 10.3 The Seesaw Effect of Bond Prices and Interest Rates
A floating-rate note is a form of debt instrument that is similar to a standard fixed-rate bond but has a variable interest rate. Rates for floating-rate bonds are typically tied to a benchmark interest rate that exists in the economy. Common benchmark rates include the US Treasury note rate, the Federal Reserve funds rate (federal funds rate), the London Interbank Offered Rate (LIBOR), and the prime rate.
So, investors who decide to purchase normal (fixed rate) bonds may not be thrilled to hear that the economy is signaling inflation and that interest rates are forecasted to rise. These bond investors are aware that when interest rates rise, their bond investments will lose value. This is not the case with floating- or variable-rate bonds.
Bonds with very low coupon rates are referred to as deep discount bonds. Of course, the bond that has the greatest discount is the zero-coupon bond, with a coupon rate of zero. The smaller the coupon rate, the greater the change in price when interest rates move.
LINK TO LEARNINGRelationship between Bond Prices and Interest RatesReview this video (https://openstax.org/r/relationship-bond-prices) explaining the relationship between bond prices and interest rates within financial and capital markets.
10.2
Bond Valuation
Learning Outcomes
By the end of this section, you will be able to:
- Determine the value (price) of a bond.
- Understand the characteristics of and differences between discount and premium bonds.
- Draw a timeline indicating bond cash flows.
- Differentiate between fixed-rate and variable-rate bonds.
- Determine bond yields.
Pricing a Bond in Steps
Why do we want to learn how to price a bond? The answer goes to the heart of finance: the valuation of assets. We need to ascertain what a given bond is worth to a willing buyer and a willing seller. What is its value to these interested parties? Remember that a bond is a financial asset that a company sells to raise money from willing investors. Whether you are the company selling the bond or the investor buying the bond, you want to make sure that you are selling or buying at the best available price.
Let’s begin our pricing examples with the 3M Company corporate bond listed in Table 10.1 above. The table
information tells us that 3M issued a series of corporate bonds that promise to pay coupons annually on September 19 and to pay back the principal, or face value, on the maturity date of September 19, 2026. While this is not specified in the table, let’s say these are 15-year corporate bonds. In that case, we know that they were issued on September 20, 2011.
The 3M bonds have an annual coupon rate of 2.25%, which indicates that the annual interest payment on the bond will be the face value (assumed to be $1,000.00 multiplied by 2.25%), or $22.50. The appropriate discount rate to apply to these future payments is the yield to bond maturity, 1.24%.
Note that the 3M bond is selling at a premium (above par or face value) due to the fact that its coupon rate is greater than the YTM percentage. This means that the bond earns more value in interest than it loses due to discounting its cash flows to allow for the time value of money principle.
Finally, the table tells us some of the bond’s features. For example, Standard & Poor’s, an international rating agency, rates 3M Co. as A+ (high credit quality). Additionally, the bonds are designated as callable, meaning that 3M has the option of redeeming them before their maturity on September 19, 2026.
We can price a bond using the same methods from earlier chapters: an equation, a calculator, and a spreadsheet. Let’s start with the equation method (see Figure 10.4).
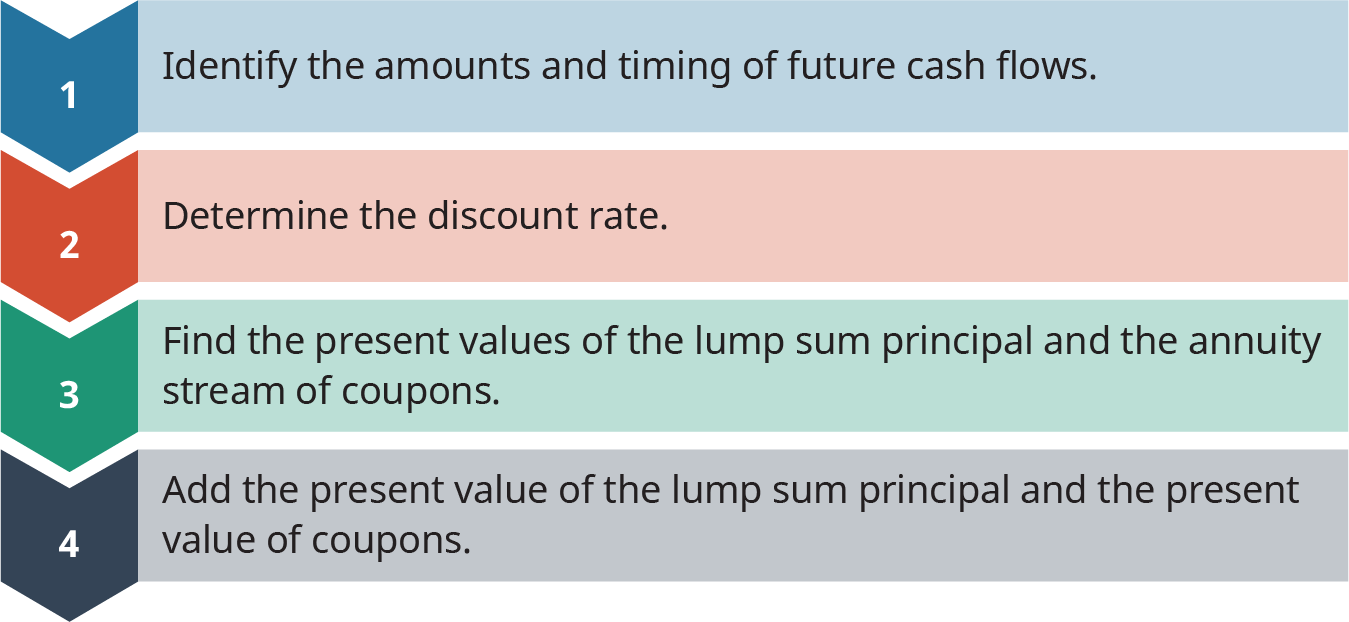
Figure 10.4 Steps in Pricing a Bond
The first step is to identify the amounts and the timing of the two types of future cash flows to be received on the bond. Any bond that pays interest or coupon payments (coupon bonds) will have two sources of future cash flow to its bondholder/investor: the periodic coupon payments, which are a form of annuity, and the final lump sum payment of the face value amount at maturity.
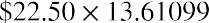
As discussed above, the principal or face value is paid in a one-time lump sum payment at bond maturity. In our example with 3M Co., this is the $1,000 par value of the bond that will be paid on the maturity date of September 19, 2026. Step 1 is to lay out the timing and amount of the future cash flows. The first future cash flow we need to determine is the annual interest payment. Here, it is the coupon rate of 2.25% times the par value of the bond. As mentioned above, we will use $1,000 as the par value of this bond, so the annual coupon or interest payment will equal $22.50:


The next future cash flow that we need to determine is the payment of the par value or principal—in this case, the $1,000 par value of the bond—at the maturity date of September 19, 2026. We can set out the future cash flows for the bond as shown in Table 10.2:
|
1 |
2 |
3 |
4 |
5 |
6 |
7 |
8 |
9 |
10 |
11 |
12 |
13 |
14 |
15 |
|
|
Coupons |
$22.50 |
$22.50 |
$22.50 |
$22.50 |
$22.50 |
$22.50 |
$22.50 |
$22.50 |
$22.50 |
$22.50 |
$22.50 |
$22.50 |
$22.50 |
$22.50 |
$22.50 |
|
Principal |
|
|
|
|
|
|
|
|
|
|
|
|
|
|
$1,000 |
Table 10.2
Note that annual coupon payments are made each year on September 19, and the first annual coupon payment date is September 19, 2012. The annual payments continue for 15 years, with the last payment being made on September 19, 2026. At this point, we can apply previously learned concepts: the coupon payments constitute an annuity stream, or payments of the same amount at regular intervals.
The principal of $1,000 is also paid out at maturity. Here, we recognize another key concept: the final amount is a lump sum payment. So, we now have the promised set of future cash flows for the 3M Co. bond.
In Step 2, we will need to decide on a discount rate to use on these future bond cash payments. For now, we will jump to the answer and simply use the YTM of 1.24% from the bond data in Table 10.1. Later in the chapter, we will develop the concepts behind how an appropriate discount rate is determined.
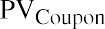 For Step 3, we now apply two equations to the set of future cash flows from the bond. This will then provide us with the present values of these cash flows, or the expected present-day value of the bond. Because we know that the coupon payments constitute an annuity stream, we can use the equation for the present value of an annuity (discussed in Time Value of Money II: Equal Multiple Payments. To value the one-time par value payment, we use the equation for the present value of a lump sum payment. So, by combining these, we will have the present value of the coupon payment stream, or


So, for our example above, this becomes


Next, we need to determine the present value of the payment of the par or face value of the bond at maturity. This is calculated as follows:

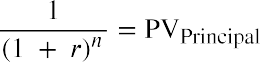
Inserting our values into this formula gives us


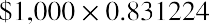

Adding the present values of the two payment streams gives us

Our bond price is $1,137.47. This bond price represents the value of the financial asset to both a willing buyer and a willing seller.
 In this example, the willing seller is 3M Company. The willing buyer is an investor who is demanding a 1.24% yield on the investment. As per Table 10.1 above, the 3M bond sold for $1,051.20 in March 2021. However, we
display the price as a percentage of the par value, so we have the displayed price as
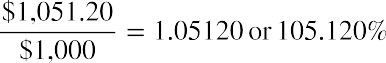
Because we round the percent of par, we do not see the cents digit in the quoted price.
Pricing a Bond Using a Financial Calculator
A financial calculator can also be used to solve common types of bond valuations. For example, what would be the current price (value) of a 4% coupon bond, paid semiannually, with a face value of $1,000 and a remaining term to maturity of 15 years, assuming a required YTM rate of 5%? The steps to solve this problem are shown in Table 10.3 below.
 Step12Description3Clear calculator registerEnter future or par value as a negative amount Enter interest rateEnterDisplayCE/C0.0000 1000 +|- FV FV =-1,000.00002.5 I/YI/Y =2.50004Enter periods Enter periodsEnter coupon payment as a negative amountCompute present value or price30 NN =30.0000520 +|- PMTPMT-20.00006CPT PVPV =895.3485
Table 10.3 Calculator Steps for Bond Valuations1
The current price is $895.35.
Time Value Connection
As we have briefly discussed, bond valuation is determined by time value of money techniques, most notably present value calculations. This makes logical sense when one considers that an investment in a bond involves a series of future cash inflows, or payments from the bond issuer to the bondholder over the term of the bond’s maturity.
To determine the value of a bond today, the two-step time value of money calculation we discussed earlier must be used, and the present value of a series of coupon payments (or an annuity) must be determined. This present value amount will then be added to the present value of a single lump sum payment (the principal or face value) that will come to the bondholder at the end of the bond’s term (maturity).
Fixed Income
Because standard fixed-rate bonds have their coupon payments and maturity amounts locked in, they are often referred to as fixed-income investments. This is because their values are relatively straightforward to calculate. Bonds are generally viewed as stable investments that offer income and a lower amount of volatility compared to stocks.
- The specific financial calculator in these examples is the Texas Instruments BA II PlusTM Professional model, but you can use other financial calculators for these types of calculations.
While yields provided by corporate and government bonds such as US T-bills and municipal bonds are currently low because the Federal Reserve System (the Fed) has kept interest rates low for several years, investors may still consider adding bonds to their portfolios.2 This is especially true as investors enter their retirement years and seek to generate income while avoiding the volatility of the stock market. Such investors can add a mix of individual bonds, mutual funds, or exchange-traded funds to their portfolios, thus generating potential return while keeping risks at a minimum. Fixed-income investments such as intermediate- or longer- term bond funds are still providing good yields despite the low-interest-rate state of the economy.
It is important to note, however, that even though bonds are generally thought of as safer investments, they still are subject to a number of risks. Because income from most bonds is fixed, such instruments can have their values eroded by external factors such as interest rates and inflation. We will discuss some of these risks after the next section.
|
1 |
2 |
3 |
4 |
5 |
6 |
7 |
8 |
9 |
10 |
|
|
End Date |
6/30/20 |
12/31/20 |
6/30/21 |
12/31/21 |
6/30/22 |
12/31/22 |
6/30/23 |
12/31/23 |
6/30/24 |
12/31/24 |
|
Coupon |
$4,500 |
$4,500 |
$4,500 |
$4,500 |
$4,500 |
$4,500 |
$4,500 |
$4,500 |
$4,500 |
$4,500 |
|
Principal |
|
|
|
|
|
|
|
|
|
$100,000 |
Table 10.4
Table 10.4 shows the cash inflow of a five-year, 9%, $100,000 corporate bond dated January 1, 2020. The bond will have coupon (interest) payment dates of June 30 and December 31 for each of the following five years.
Because the bond was issued on January 1, 2020, the year 2020 is the first full year of the bond, followed by the years 2021, 2022, 2023, and 2024, with the bond maturing in December of the latter year.
Cash inflows will be (1) the coupon or interest payments of 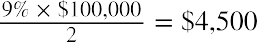 , paid to the bondholder every six months, and (2) the one-time principal or face-value payment of $100,000 upon maturity on December 31, 2024.
Yields and Coupon Rates
The two interest rates that we associate with a bond are often confusing to students when they first begin to work with bonds. The coupon rate is the interest rate printed on the bond; this is only used to determine the interest or coupon payments. The yield to maturity (YTM) is an interest rate that is used to discount the bond’s future cash flow. The YTM is derived from the marketplace and is based on the riskiness of future cash flows.
As we have seen when pricing bonds, a bond’s YTM is the rate of return that the bondholder will receive at the current price if the investor holds the bond to maturity.
Yield to Maturity
As noted above, the market sets this discount rate, or the yield to maturity. The YTM reflects the going rate in the bond market for this type of bond and the bond issuer’s perceived ability to make the future payments. Hence, we base the yield on a mutually agreeable price between seller and buyer. The bond market determines the YTM and the available supply of competing financial assets. By competing against other available financial assets, the YTM reflects the risk-free rate and inflation, plus such premiums as maturity and default specific to the issued bond.
The YTM is the expected return rate on the bond held to maturity. How do we determine the bond’s YTM? We can use our same three trusty methods: equations, a financial calculator, and Microsoft Excel (as shown at the end of the chapter).
- Adam Hayes. “What Do Constantly Low Bond Yields Mean for the Stock Market?” Investopedia. June 15, 2021. https://www.investopedia.com/ask/answers/061715/how-can-bond-yield-influence-stock-market.asp
Determining Bond Yield Using an Equation


The solution, when solving for discount rates, requires us to revisit the bond pricing formula, which is


Of course, with one equation, we can solve for only one unknown, and here the variable of concern is r, which is the YTM. Unfortunately, it is difficult to isolate r on the left-hand side of the equation. Therefore, we need to use a calculator or spreadsheet to solve for the bond’s YTM.
Let’s take another bond, the Coca-Cola bond, from Table 10.1 above and again back up our time to March 2021. If the Coca-Cola bond has just been issued in March 2021, then it would be a seven-year, semiannual bond with a coupon rate of 1.0% and an original price of $952.06 at the time of issue (Table 10.5).
Bond CharacteristicDetailsPrice (% of par)95.20Coupon rate1%Maturity dateMarch 15, 2028 Standard & Poor’s RatingA+Coupon payment frequency SemiannualFirst coupon dateSeptember 1, 2021TypeCorporateCallable?Yes
Table 10.5 Overview of Coca-Cola Bond (as of March 2021) (credit: FINRA-Markets.Morningstar)
Determining Bond Yield Using a Calculator
For the Coca-Cola bond above, what was the bond’s YTM at its issue date? This is not an easy problem to solve with a mathematical formula. It is far more practical, not to mention easier, to use a financial calculator or an Excel spreadsheet to solve for bond prices, yields, and maturity periods.
We will cover Excel applications later, but we can jump into some calculator examples right now. So, to calculate the yield on the Coca-Cola bond, we’ll start by entering the values we have for this bond into a calculator. The values we know are as follows:

If the bond’s selling price was $952.06 at issue, we have all the information we need to determine the bond’s YTM at issue. Table 10.6 shows the steps for using a calculator to come to an answer.
StepDescription1Clear calculator registerEnterCE/C2Enter present value or price as a negative amount 952.06 +|- PV PV =Display0.0000-952.0600
Table 10.6 Calculator Steps for Bond’s Yield to Maturity at Issue
|
|
|||
|
|
|
|
1,000.0000 |
|
|
14 N |
N = |
14.0000 |
|
5Enter coupon payment |
|
PMT = |
5.0000 |
|
6Compute interest rate |
CPT I/Y |
I/Y = |
0.8651 |

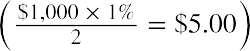
Table 10.6 Calculator Steps for Bond’s Yield to Maturity at Issue
The calculated I/Y (interest rate or YTM) of 0.8651 is a semiannual figure because the periods and coupon payments we entered for the calculation are semiannual values. To covert the semiannual value into an annual rate, we will need multiply the calculated I/Y by 2. This gives us an amount of 1.73%.
So, the YTM of the Coca-Cola bond at issue date was 1.73%. It is important to know that unless otherwise indicated, bond yields are expressed in annual percentage terms.
We have just demonstrated how a calculator can be used to determine the YTM or interest rate of a bond. Let’s look at a few more examples that cover the most common types of bond problems. These are determining a YTM, calculating a bond’s current price (or value), and determining a bond’s maturity period.
First, let’s work through another example of calculating a YTM, but this time with a bond that has annual interest payments instead of semiannual coupons.
Let’s say you are considering buying a bond, but you want to calculate the YTM to determine if it will meet your overall return requirements. Some facts you have on the bond are that it has a $1,000 face value and that it matures in 12 years. Assume that the current price of the bond is $675 and it pays coupons annually at 3.5%. See Table 10.7 for the steps to calculate the YTM.
 Step123456DescriptionClear calculator registerEnter present value or price as a negative amount Enter future or par valueEnter periods (12 years) Enter coupon paymentCompute interest rateEnterCE/C675 +|- PV PV =1000 FV12 N35 PMTCPT I/YFV =N =Display0.0000-675.00001,000.000012.0000PMT =I/Y =35.00007.7589
Table 10.7 Calculator Steps for Computing Yield to Maturity
By following the steps in the table above, you will arrive at a YTM of 7.76%.
Using a calculator is fast and accurate for finding bond yields. Thus, if you know the bond’s current price and all of the future cash flows, you can find the YTM, or the return rate that the bond buyer is receiving on the funds loaned to the bond issuer. As mentioned, Excel spreadsheets are as easy and accurate as a financial calculator for determining bond rates, and we will cover these later in the chapter.
Determining Bond Price or Value Using a Calculator
Let’s say a friend recommends a 20-year bond that has a face value of $1,000 and a 6% annual coupon rate. If similar bonds are yielding 4% annually, what would be a fair price for this bond today? Table 10.8 shows the steps to make this determination.
 Step12345DescriptionClear calculator registerEnter future or par value as a negative amount Enter interest rate (4% annual rate)Enter periods (20 years)Enter coupon payment a negative amountCompute present value or priceEnterCE/C1000 +|- FV FV =4 I/Y20 Nas 60 +|- PMT CPT PVI/Y =N =Display0.0000-1,000.00004.000020.0000PMT =-60.00006PV =1,271.8065
Table 10.8 Calculator Steps for Computing Present Value
So, the bond should be priced today at $1,271.81.
Determining Bond Maturity Using a Calculator
Imagine you are considering investing in a bond that is selling for $820, has a face value of $1,000, and has an annual coupon rate of 3%. If the YTM is 10%, how long would it take for the bond to mature? See Table 10.9 for the steps to calculate the time to maturity.
|
Description |
Enter |
|
|
|
1 |
Clear calculator register |
CE/C |
0.0000 |
|
2 |
Enter present value or price as a negative amount |
820 +|- PV |
PV =-820.0000 |
|
3 |
Enter interest rate (10% annual rate) |
10 I/Y |
I/Y =10.0000 |
|
4 |
Enter future or par value |
1000 FV |
FV =1,000.0000 |
|
5 |
|
30 PMT |
PMT =30.0000 |
|
6 |
Compute periods until maturity |
CPT N |
N =3.1188 |


Table 10.9 Calculator Steps for Computing Time to Maturity
THINK IT THROUGHUsing a CalculatorIf a $1,000 face value bond is selling for $595, has 20 years until it matures, and has a YTM of 6.5%, what are the coupon rate and the periodic coupon payment of the bond? Follow the steps in Table 10.10.
So, the bond’s time to maturity would be 3.12 years.
|
|
||
|
1Clear calculator register |
CE/C |
|
|
2Enter present value or price as a negative amount |
595 +|- PV PV = |
-595.0000 |
|
3Enter periods |
20 NN = |
20.0000 |
|
4Enter future or par value |
1000 FVFV = |
1,000.0000 |
 StepDescriptionEnter interest rate or YTMCompute coupon paymentEnter6.5 I/Y CPT PMTI/Y =Display6.5000PMT =28.2437Table 10.10 Calculator Steps for Computing Coupon PaymentSolution:The annual coupon payment amount is $28.24. This means the coupon rate on the bond is.
The Coupon Rate
The coupon rate is the rate that we use to determine the amount of a bond’s coupon payments. The issuer states the rate as an annual rate, even though payments may be made more frequently. Thus, for semiannual bonds, the most common type of corporate and government bond, the coupon payment is the par value of the bond multiplied by the annual coupon rate and then divided by the number of payments per year, 2.


 We have already seen the coupon rate. The first bond we reviewed, the 3M Co. bond, was an annual coupon bond with a coupon rate of 2.25%. Using a par value of $1,000, we determined that the annual coupon payments would be.
For the Coca-Cola bond, we note from Table 10.5 that it has a coupon rate of 1% and is paid semiannually. Using a par value of $1,000, we can determine that the coupon payments would be  .
.
The Relationship of Yield to Maturity and Coupon Rate to Bond Prices
The value or price of any bond has a direct relationship with the YTM and the coupon rate.
- When the coupon rate of a bond exceeds the YTM, the bond sells at a premium compared to its par value. That is, market demand will push the price of the bond to an amount greater that than its face or par value. We call this kind of bond a premium bond.
- When the coupon rate is less than the YTM, the bond sells at a discounted amount, or less than its par value. We refer to such a bond as a discount bond.
- When the coupon rate and YTM are identical, a bond will sell at its par value. Bonds that experience this scenario in the market are referred to as par value bonds.
The interest or coupon payments of a bond are determined by its coupon rate and are calculated by multiplying the face value of the bond by this coupon rate.
The inverse relationship of interest rates and bond prices is an important concept for investors to know. Because interest rates fluctuate and can change significantly over time, it is important to understand how these changes will impact bond values.
10.3
Using the Yield Curve
Learning Outcomes
By the end of this section, you will be able to:
- Use the yield curve to show the term structure of interest rates.
- Describe and define changes in the yield curve shape.
- Explain the importance of the yield curve shape.
Term Structure of Interest Rates
The expected yields of various bonds across different maturity periods are referred to as the term structure of interest rates. This is because they represent interest rates for different periods of time, maturities, or terms.
When interest rate yields are plotted against their respective maturity periods and these plotted points are connected, the resulting line is called a yield curve. Essentially, the yield curve is a result of this plotting process and becomes a graphical representation of the term structure of interest rates. A yield curve will always be constructed by showing the value of yields (rates) on the y-axis and maturities or time periods on the x-axis (see Figure 10.5).
To create a useful graph of the yield curve, interest rate yields should be computed for all government bonds at all remaining times to maturity. For example, the yields on all government bonds with a single year remaining until maturity should be calculated. This value is then plotted on the y-axis against the one-year term on the x-axis. Similarly, yields on government bonds with two years remaining until maturity are calculated and plotted on the y-axis against two years on the x-axis, and so on, until a point of critical mass of information is reached and the resulting graph displays useful information.
The yield curve for government bonds is also known as the risk-free yield curve because these securities are thought of as safe investments that are not expected to fail or default and will in all likelihood repay or otherwise meet all financial obligations made through the bond issuance.
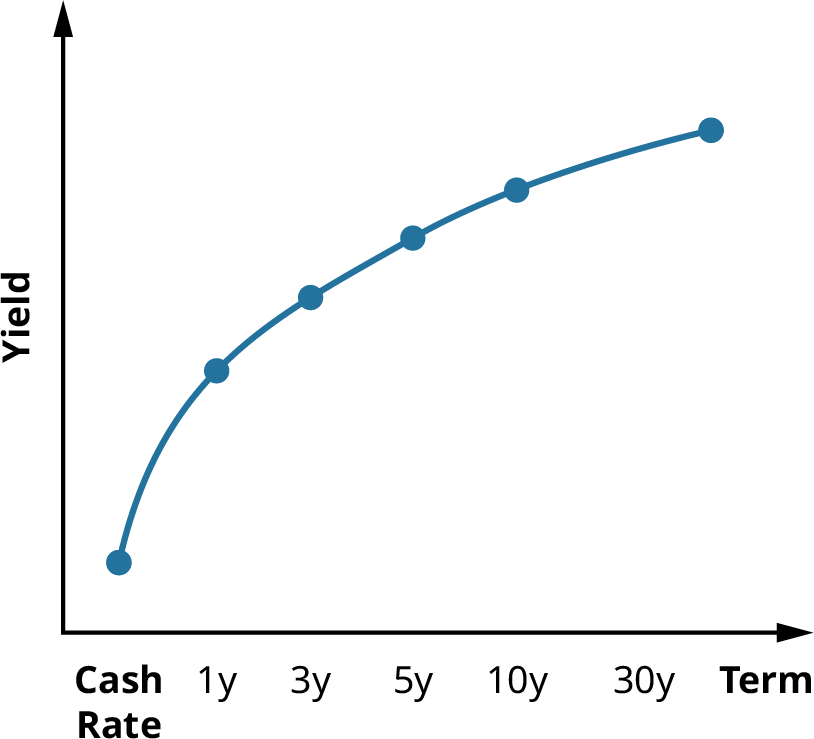
Figure 10.5 A Normal Yield Curve: Long-Term Rates Are Higher Than Short-Term Rates
A normal yield curve slopes upward, with yield increasing as the term increases. This is because yields on fixed-income investments such as bonds will rise as maturity periods increase and produce greater levels of risk.
Corporate issuers of bonds will usually offer bond issues at higher yields that the government, which is understandable because they are potentially riskier for investors. Government securities are guaranteed by governments and have little to no chance of default or nonpayment. This is not the case for corporate bonds, where there is always a chance of default, though the likelihood of this occurring will vary by individual company or issuer as well as by bond type and term. We will discuss bond default and default risk next.
LINK TO LEARNINGThe Yield CurveReview this video (https://openstax.org/r/introduction-to-the-yield-curve) that introduces the concept of the yield curve.
Different Shapes of the Yield Curve
There are two important elements to any yield curve that will define its shape: its level and its slope. The level of a yield curve directly relates to the yield rates depicted on the y-axis of the graph (see Figure 10.6). The slope of the yield curve indicates the difference between yields on short-term and longer-term investments. The difference in yields is primarily due to investors’ expectations of the direction of interest rates in the economy and how the federal funds rate (referred to as cash rate in many countries) is uncertain and may differ significantly over time. As an example, yields on three-year bonds incorporate the expectations of investors on how bank rates might move over the next three years, combined with the uncertainty of those rates over the three-year period.
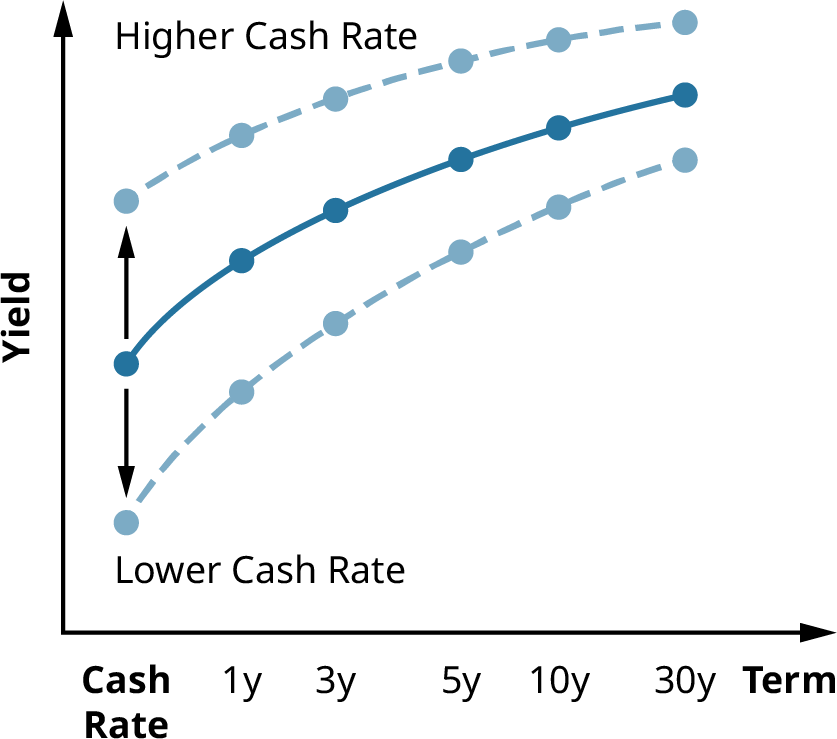
Figure 10.6 Changes in Yield Curve Depending on Cash Rate
As we briefly discussed above, a positive or normal yield curve is indicative of the investment community’s requirements for higher rates of return as financial consideration for assuming the risk of entering into fixed- income investments, such as the purchase of bond issues. Typically, as a bond term increases, so will the potential interest rate risk to the bondholder. Therefore, bonds with longer terms will usually carry higher coupon rates to make returns greater for investors. Additionally, economists have come to believe that a steep positive yield curve is a sign that investors anticipate relatively high inflation in the future and thus higher interest rates accompanied by higher investment yields over shorter (inflationary) periods of time.
Normal yield curves are generally observed during periods of economic expansion, when growth and inflation are increasing. In any expansionary economy, there is a greater likelihood that future interest rates will be higher than current rates. This tends to occur because investors will anticipate the Fed or the central bank raising its short-term rates in response to higher inflation rates within the economy.
CONCEPTS IN PRACTICEHow COVID-19 Impacted the Yield CurveFigure 10.7 shows the relatively normal-shaped yield curve effective in February 2021.
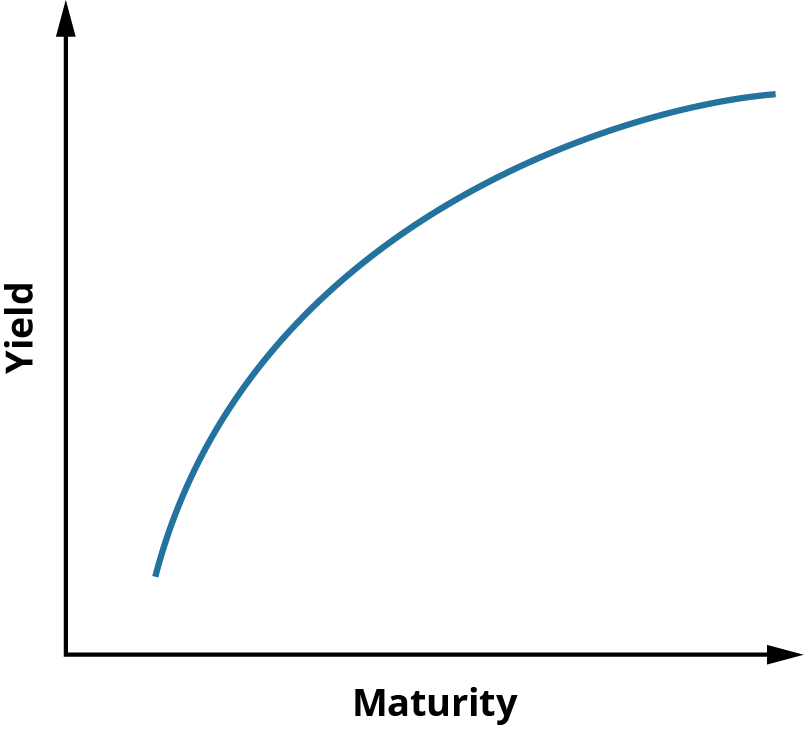
Figure 10.7 Yield Curve in February 2021
A yield curve with an inverted (downward-sloping) shape is considered unusual and will occur when long- term rates are lower than short-term rates. This causes the yield curve to assume an inverted shape with a negative slope. An inverted yield curve has historically been observed as a prelude to a general decline in economic activity and interest rate levels. In some countries, such as the United States, an inverted yield curve has been associated with upcoming recession and economic contraction.
This may occur because central banks, such as the Federal Reserve in the United States, will often attempt to stimulate a stagnant economy by reducing interest rates. Essentially, the potential actions of the central bank to improve the economy have the effect of lowering overall money rates with the economy, which is exactly what investors anticipated would happen and why the yield curve was inverted to begin with.
The yield curve was considered normal with an upward slope in August 2018, as shown in Figure 10.8, but the curve inverted in March 2019 as yields on short-term bonds exceeded those of longer-term bonds, resulting in concerns surrounding impending recession and other economic problems. This inverted shape to the yield curve continued into 2020, as evidenced in Figure 10.9.
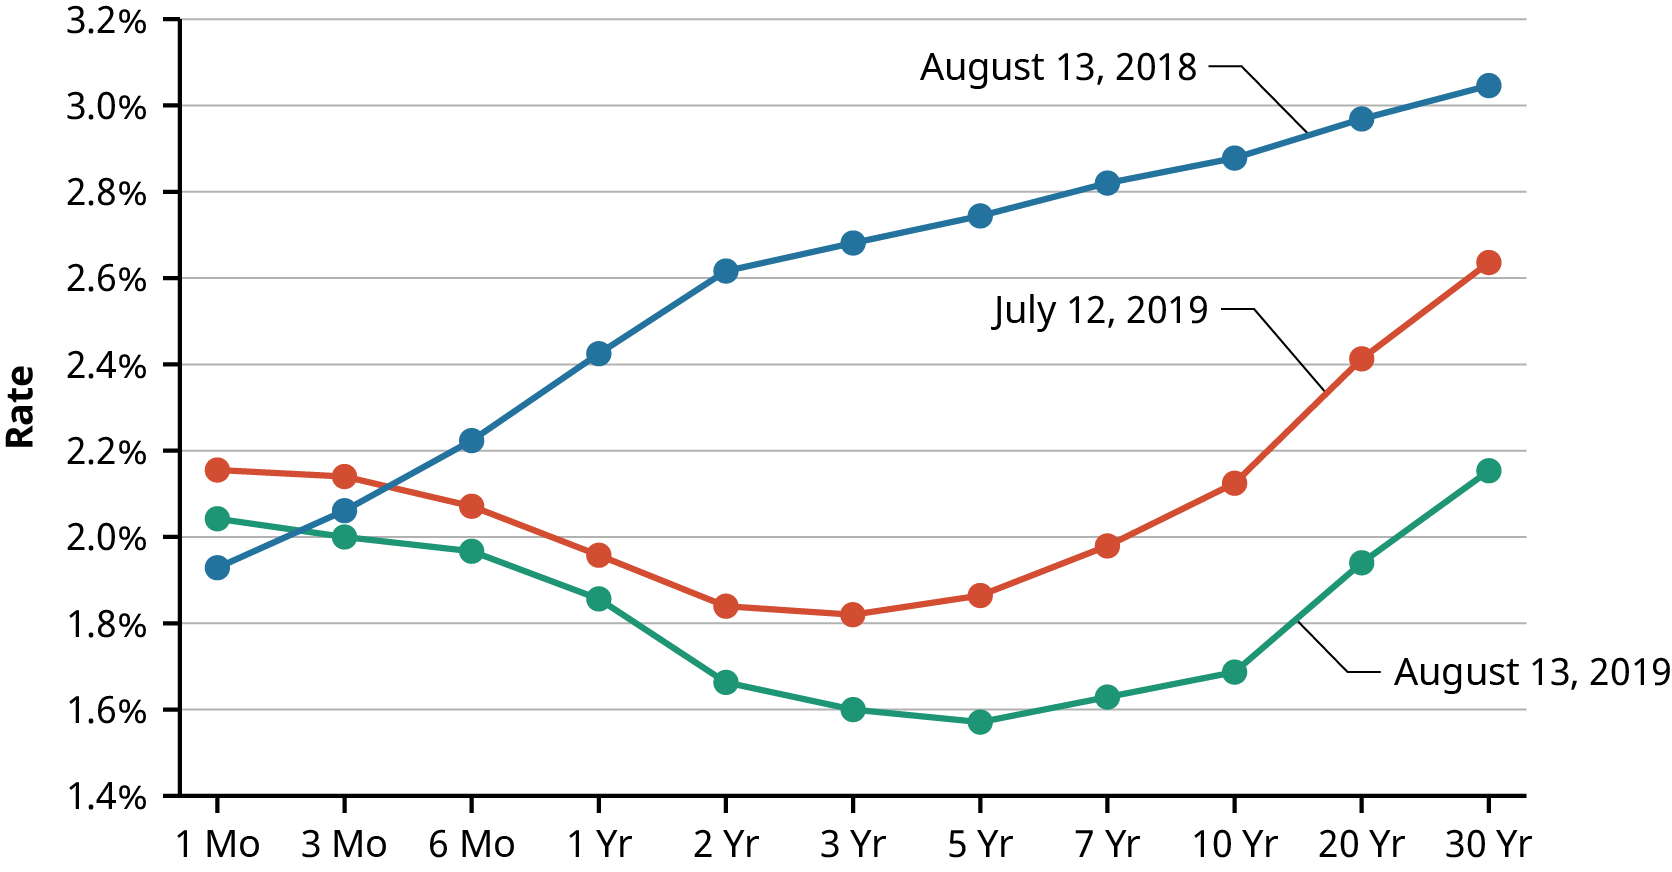
Figure 10.8 The Economy Shifts to an Inverted Yield Curve (data source: US Department of the Treasury, Resource Center, Daily Treasury Yield Curve Rates)
Yield curves constructed on different days in early 2020 appeared similar to the examples below. Again, these are obviously not normal yield structures. As a specific example, note on the February 21, 2020, curve
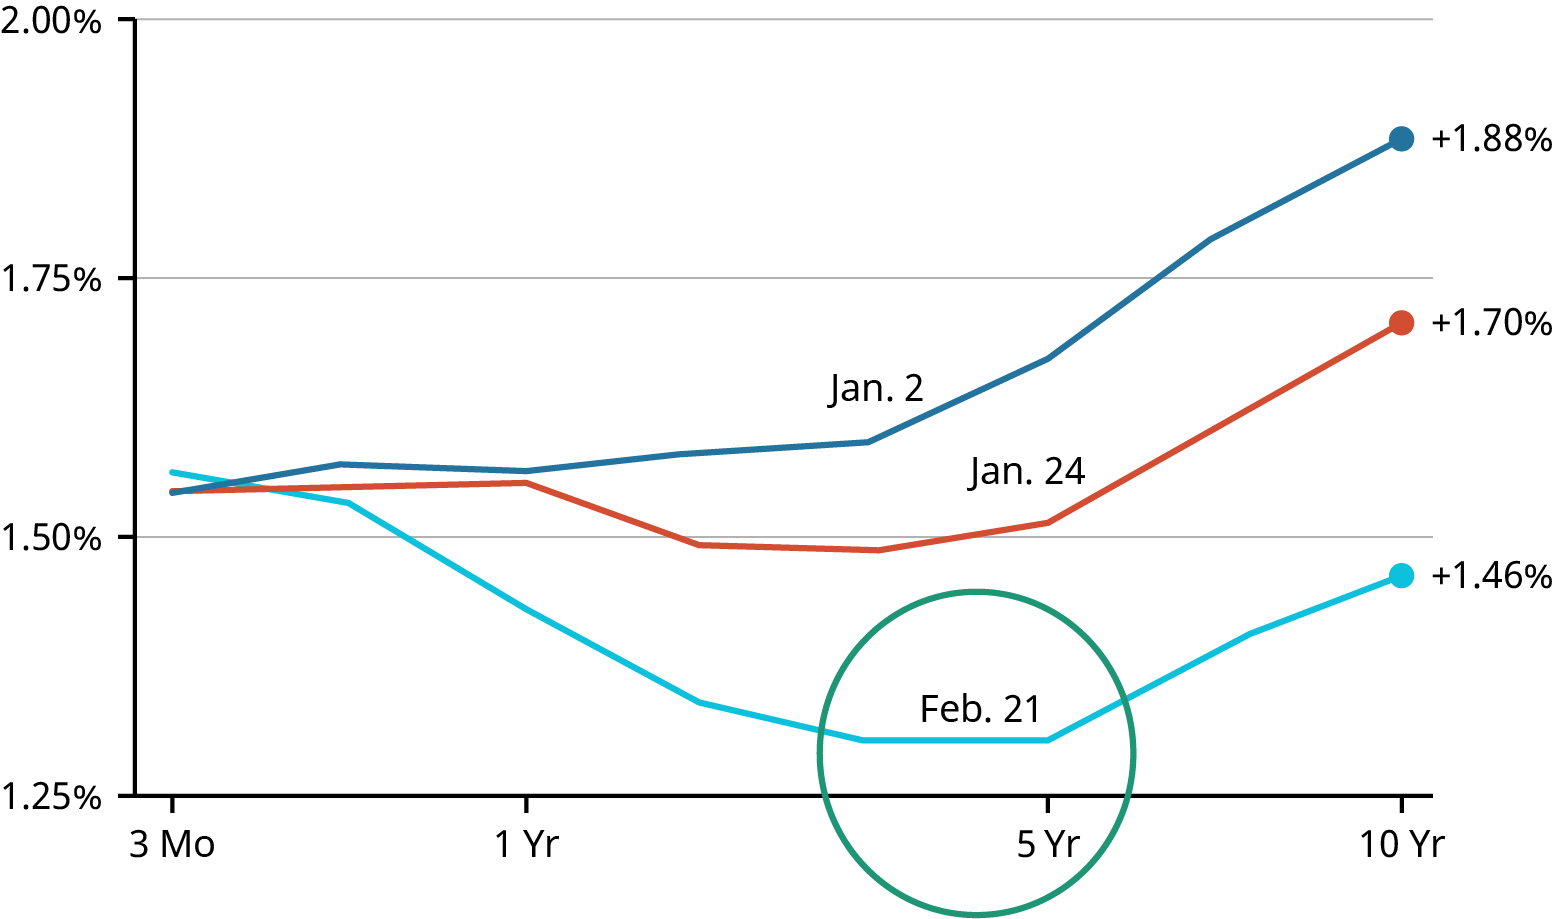 that rates on five-year securities are lower than those of one-year and even three-month securities.Figure 10.9 Elements of Inversion in Recent Yield Curves (data source: US Department of the Treasury, Resource Center, Daily Treasury Yield Curve Rates)This inverted yield curve signaled the beginning of a recessionary period in the United States, which was compounded by the COVID-19 pandemic and the closing of many restaurants and businesses.In March and April 2020, the US economy experienced a significant decline. Most economic indicators dropped so badly that the National Bureau of Economic Research’s Business Cycle Dating Committee, the US agency that officially declares recessions, was required to intervene.3The recession declaration process by the committee is completed over the course of four months, but in this instance, it only took a total of 15 weeks for the committee to make its declaration. This remains the fastest declaration by the committee on record since the founding of the National Bureau of Economic Research (NBER) in 1978.4In July 2021, the committee declared that the economy had reached a trough in April 2020, marking the end of the recession of the early 2020s and making it the shortest US recession on record as well as the most quickly identified one.5(sources: www.nytimes.com/2019/11/08/business/yield-curve-recession-indicator.html; www.nber.org/ news/business-cycle-dating-committee-announcement-june-8-2020; fredblog.stlouisfed.org/2020/11/are- we-still-in-a-recession/)
A flat shape for the yield curve occurs when there is not a great deal of difference between short-term and long-term yields (see Figure 10.10). A flat curve is usually not long lasting and is often observed when the curve is transitioning between a normal and an inverted shape, or vice versa.
A flat yield curve has also been observed as a result of low interest rate levels or some types of unconventional monetary policy.
- National Bureau of Economic Research. “Business Cycle Dating Committee Announcement June 8, 2020.” NBER News.
- Jeffrey Frankel. “The US Is Officially in Recession Thanks to the Corona Virus Crisis.” The Belfer Center for Science and International Affairs. Harvard Kennedy School, June 16, 2020. https://www.belfercenter.org/publication/us-officially-recession- thanks-corona-virus-crisis
- National Bureau of Economic Research. “Business Cycle Dating Committee Announcement July 19, 2021.” NBER News. July 19, 2021. https://www.nber.org/news/business-cycle-dating-committee-announcement-july-19-2021
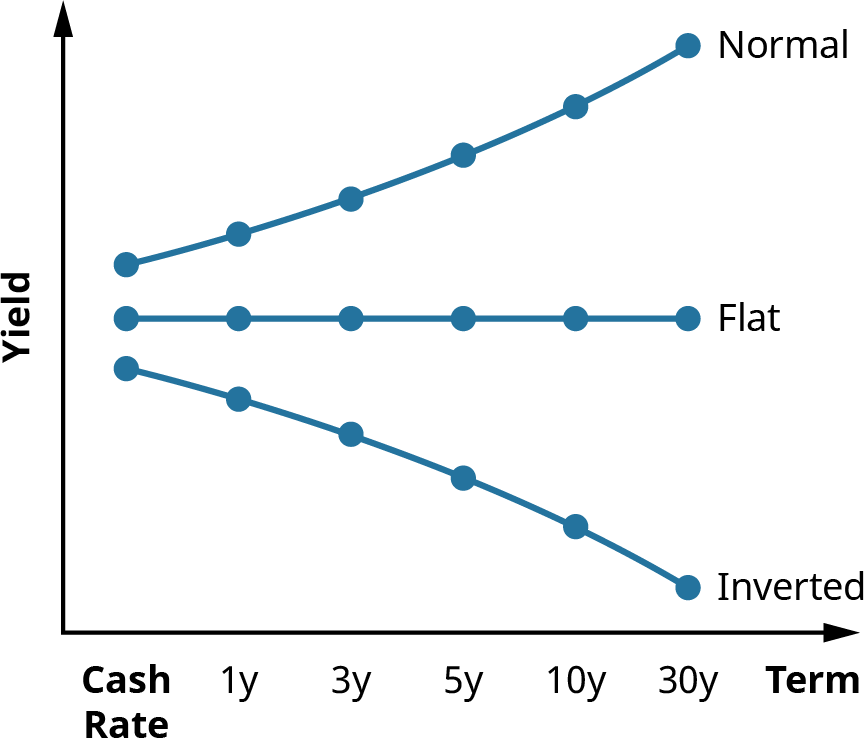
Figure 10.10 Graph Depicting Normal, Flat, and Inverted Yield Curves
Why Is the Yield Curve Important?
Market technicians, brokers, and investment analysts will study the yield curve in great detail by keeping track of its many changes and movements. This is because of the overall importance of the yield curve as an economic indicator and how it can be representative of the ideas, attitudes, and bond market expectations of individuals as well as large institutional investors that exert significant influence on investment markets and the economy as a whole.
10.4
Risks of Interest Rates and Default
Learning Outcomes
By the end of this section, you will be able to:
- Define interest rate, default, and other common forms of bond risk.
- Calculate the primary indicator of interest rate risk.
- Determine factors impacting default risk.
- Understand bond laddering as an investment strategy.
- List major rating agencies and their indications of default.
- Define and calculate the yield to maturity (YTM) on a bond.
Bond Risks
As we touched on earlier, bonds are fixed-income investments, and because of this, they are subject to a number of risks that could have negative effects on their market value. The most common and best-known risks are interest rate risk and default risk, but other risks exist that should be understood. Among these risks are the following:
- Credit risk. If investors believe that a bond issuer is unlikely to meet its payment commitments, they may demand a higher yield to purchase the bond issue in the first place. Due to the relative stability of governments compared to corporations, government bonds are considered to have low credit risk.
- Liquidity risk. If investors believe that a bond may be difficult to sell, it will likely have a higher yield. This has the effect of compensating the bondholder for the lack of liquidity (the ability to cash out of the bond). Government bonds usually have the lowest yields of all investments available and are typically among the most liquid in any country where they are traded. Government securities will only face significant liquidity risk in times of great economic distress.
- Duration risk. Duration risk is the risk associated with the sensitivity of a bond’s price to a single 1% change in interest rates. A bond’s duration is expressed in numerical measurements. The higher the duration number, the more sensitive a bond investment will be to changes in interest rates.
- Call risk and reinvestment risk. Call risk is the risk of bonds being redeemed or called by the issuing firm before their maturity dates. Corporations may elect to call a bond issue (provided the bond issue has a call feature) when interest rates drop and companies are in a position to save a great deal of money by issuing new bonds with lower coupon rates. To investors, this is a risk in and of itself, but call risk also has the effect of potentially causing reinvestment risk. Reinvestment risk is defined as the risk to investors when they find themselves facing unfavorable alternatives for investing the proceeds from their called bonds in new, lower-paying investments. This can potentially lead to substantial financial loss for the original bond investors.
- Term risk. Investors will generally demand higher returns for lending funds at fixed interest rates. This is because doing so exposes them to the risks presented by rising interest rates and the negative impact of these higher rates on their bond holdings. In a scenario of rising interest rates, investors will find that their return from lending money through a bond purchase just once, at a fixed interest rate, will be lower than the return they might have realized from making several different investments for much shorter periods of time. Term risk is usually measured by a special indicator referred to as the term premium.
As mentioned above, however, the most common forms of bond risk are interest rate risk and default risk.
Interest Rate Risk
As we have discussed, when interest rates rise, bond values will fall. This is the general concept behind interest rate risk. Any investor in fixed-income securities (such as bonds) will have to contend with interest rate risk at one time or another. Interest rate risk is also referred to as market risk and usually increases the longer an investor maintains a bond investment.
Default Risk
Any time a bond is purchased, the investor is taking a risk that the bond issuer may be late in making scheduled payments on a bond issue—or, in the worst case, may not be able to make payments at all. This is the underlying idea behind the concept of default risk.
Because US Treasury securities have the full backing of the government, they are generally considered free of default risk. However, most corporate bonds will face some possibility of default. Obviously, some bonds and their issuing companies are riskier in this respect than others.
To assist potential bond investors in understanding some of these risks, bond ratings are regularly published by a number of organizations to express their assessment of the risk quality of various bond issues. We will discuss these bond ratings and the companies that issue them next.
Bond Ratings and Rating Providers
It is important for investors to know the risks they are assuming when investing in bonds. Many investors will take advantage of information provided by bond rating services to assess the likelihood of borrowers (bond issuers) defaulting on the financial obligations of their bond issues.
To help investors evaluate the default risks of bonds, rating agencies (bond rating services) were established to evaluate bonds and other fixed-income investments, taking into consideration and then analyzing any information that has been published or otherwise made available to the investing public. These services then apply a rating system that has been developed for measuring the quality of bonds and assign individual grades to each bond and its issuing company.
The three largest and best-known bond rating providers are Fitch Ratings, Moody’s Investors Service, and Standard & Poor’s (S&P) Global Ratings. The rating system used by these services identifies the very highest- quality bonds (the least likely to default) as triple-A (AAA or Aaa), followed next in quality level by double-A bonds (AA or Aa), and so on. Any bond that is rated BBB (S&P, Fitch) / Baa (Moody’s) or higher is referred to as investment grade and is considered strong and stable by the investment community (see Table 10.11).
It is important to note that investment-grade bonds are among the most popular due to the fact that many commercial banks, as well as several pension funds, are only allowed to trade bonds that are investment grade.
Any bond that is below investment grade, or rated lower than BBB (S&P, Fitch) or Baa (Moody’s), is referred to as a high-yield bond or a junk bond. Junk bonds have had mixed levels of success for companies wishing to issue them to raise capital. In the early 1990s, the market for junk bonds collapsed, due in part to a political movement involving influential people who had been dominating corporate debt markets. This movement, combined with illegal insider trading activities conducted by investments banks, ultimately resulted in the bankruptcy of former financial giant Drexel Burnham Lambert.6
S&P / Fitch Moody’sGradeMeaningAaaInvestment Risk almost zero AAAaInvestment Low riskAAInvestment Risky if economy declinesBaaInvestment Some risk; more if economy declines BBBaSpeculative RiskyBBSpeculative Risky; expected to get worseCaaSpeculative Probably bankruptcy CCCaSpeculative Probably bankruptcyCSpeculative In bankruptcy or defaultSpeculative In bankruptcy or default
Table 10.11 Bond Ratings (sources: S&P Global Ratings; Moody’s)
The market for junk bonds enjoyed a brief resurgence in popularity when the economy improved later in the 1990s. However, in 2001, the junk bond market shrank once again, resulting in 11% of US junk bond issues defaulting.
In general, it is important to understand that bond ratings are only judgments on corporations’ future ability to repay debt obligation and their growth prospects. There is no fixed methodology or basis for calculating a bond rating. However, some financial analysts can get a strong indication of how a bond will be rated by examining certain financial ratios of the issuing firm, such as company debt ratio, earnings-to-interest ratio, and their return on assets.
CONCEPTS IN PRACTICEThe Collapse of Enron: Bond and Credit Ratings and How They ChangeThe bond rating system is not infallible. A perfect example of this is when energy giant Enron failed in 2001. After the collapse, investors correctly pointed out that a mere two months before this occurred, the company’s bonds were rated as investment grade and considered relatively safe, having little risk for investors.Background on EnronFrom its formation in 1985 through the late 1990s, Enron grew to become an energy mega-conglomerate,
- Lawrence Delevingne. “The Drexel Collapse, 25 Years Later.” CNBC. February 13, 2015. https://www.cnbc.com/2015/02/13/the- drexel-collpase-25-years-later.html
expanding into areas such as trading of futures contracts, paper products, electricity, water, pipelines, and broadband services. Reported revenues grew at an exceptional pace, Enron’s stock price continued to rise, and business was proceeding exceptionally well.
However, things were not as they appeared on the surface. Enron’s financial statements were often very confusing to shareholders and analysts. Additionally, Enron’s unscrupulous business practices included revenue misstatements and other questionable accounting practices to indicate favorable financial performance. On top of this, some of Enron’s speculative business ventures proved to be disastrous, resulting in substantial financial losses.
Initial allegations against Enron also focused on the role of their public accountants, Arthur Andersen. Andersen was one of the Big Five accounting firms in the United States at that time and had served as Enron’s auditing firm for over 16 years. According to court documents, Enron and Arthur Andersen had improperly categorized hundreds of millions of dollars of transactions as increases to the company’s shareholder equity. It was also later discovered that Andersen failed to follow generally accepted accounting principles (GAAP) when considering Enron’s dealings with related partnerships. As a result, Enron was able to conceal some of its losses from the investing public. After investigation by the United States Justice Department, the firm was indicted on obstruction of justice charges in March 2002. The combination of all of these irregularities and issues resulted in the December 2, 2001, bankruptcy of the corporation.7 It was later determined that the majority of these unethical issues had been perpetuated with the indirect knowledge or even, in some cases, by the direct actions of the board of directors or senior operational management of the company.
Specifics and Enron’s Bond Ratings
On October 27, 2001, the company began buying back all its commercial paper, valued at around $3.3 billion, in an effort to calm investor fears about Enron’s supply of cash. On November 8, Enron announced that restatements to its financial statements for the years 1997–2000 were necessary to correct several accounting violations. However, by November 28, 2001, credit rating agencies had reduced Enron’s bond rating to junk status.8
Other Examples of Significant Bond Ratings Downgrades
Some companies that have recently experienced downgrades (or potential downgrades) to their credit and bond ratings include Delta Airlines, Ford, Occidental Petroleum, Carnival Cruises, and T-Mobil. Some of these businesses, such as Delta and Carnival, are suffering the effects of the COVID-19 pandemic, but the hope is that they don’t experience the same disastrous fate as Enron.
(sources: www.britannica.com/event/Enron-scandal; www.journalofaccountancy.com/issues/2002/apr/ theriseandfallofenron.html; corporatefinanceinstitute.com/resources/knowledge/other/enron-scandal/; www.wsj.com/articles/corporate-bond-downgrades-grow-as-coronavirus-spreads-11585849497)
Concepts of Bond Returns
Bond investors earn profits through two different means: collecting interest income and generating capital gains. These are important concepts for any investor who considers putting their money in fixed-income securities such as bonds.
- Douglas O. Linder. “Enron (Lay & Skilling) Trial (2006).” Famous Trials. Accessed November 24, 2021. https://famous-trials.com/ enron
- Paul M. Healy and Krishna G. Palepu. “The Fall of Enron.” Journal of Economic Perspectives 17, no. 2 (Spring 2003): 3–26. https://doi.org/10.1257/089533003765888403
Collecting Interest Income


As we have covered, when investors buy bonds, they are lending money to bond issuers. The coupon rate of a bond is determined by the issuer and is generally tied to the overall level of interest rates in the economy at the time of issue as well as the maturity period of the bond and the credit rating of the issuer. The established coupon rate then governs how much periodic interest is paid to bondholders. For example, if an investor purchases a 5%, $1,000 bond with a 20-year maturity and annual coupon payments, that investor will receive 20 coupon payments equal toorfor a total of $1,000.
Depending on interest and inflation rates over the 20-year period, this could be a very favorable situation resulting in significant realized return for the investor. However, if interest rates and inflation over the investment period are at high levels, the investment is not nearly as attractive.
Generating Capital Gains
Many bonds are not held until their maturity dates. Should an investor require funds before maturity, they have the option to sell them through a broker in the secondary market. When this situation occurs, the investor may earn a capital gain or experience a capital loss, depending on whether the bond ends up being sold at a premium (above face value) or at a discount (below face value).
For example, if an investor bought a corporate bond yielding 7% and then the economy changed so that comparable bonds yielded 10%, the investor would have to lower their price on the original 7% bond until it also yielded the 10% market rate. Potential investors would not be very likely to buy the bond if they could simply buy a newly issued bond from an alternate issuer and receive a higher coupon rate.
It is equally possible that prevailing bond rates could fall and an investor could end up selling their bond at a higher price, thus earning a capital gain.
Bond Laddering as an Investment Strategy
There are several successful strategies for successful bond investments, but perhaps one of the most common yet ingenious of these strategies is called bond laddering. Bond ladders help investors achieve diversity in their portfolios and reduce risk while helping maintain regular cash inflows in the form of coupon payments or interest. In a bond ladder, an investor will divide their total investment dollars among various bonds that mature at regular intervals, thereby balancing risk and return. An example of a bond ladder would be to purchase 10 different bonds that have maturities of one year, two years, three years, and so on, all the way through to 10 years.
When the first bond matures, the investor will purchase a new bond that matures in 10 years to take its place in the ladder and continue the overall laddering strategy.
This strategy has several benefits. First, the shorter-term bonds in the ladder provide stability because they are less sensitive to risk than longer-term bonds. The longer-term bonds within the ladder will generally provide higher returns but with higher risk due to such factors as rising interest rates. So, by investing in bonds with different maturities and creating a bond ladder, investors can realize superior financial returns to what they would earn by only investing in short-term bonds. Also, the general level of risk from a bond ladder is reduced by the shorter-term component of the investment mix, making the bond ladder less risky than an investment that only included long-term bonds.
It is easy to see why bond laddering has become such a highly adopted bond investment strategy with investors ranging from novice to the most well-seasoned and experienced.
Interest Rate Movements and Bond Prices
We now know that when investors buy bonds, either directly or through mutual funds, they are lending money to bond-issuing firms or governments. In turn, issuers promise to pay back the principal (par or face value) when the loan is due at the bond’s maturity date.
Issuers also promise to pay bondholders periodic interest or coupon payments to compensate them for the use of their money over the term of the bond. The rate at which issuers pay investors, or the bond’s stated coupon rate, is typically fixed at the time of issuance.
We have also covered the concept that bond values have an inverse relationship with interest rates. As interest rates rise, bond prices fall, and when interest rates fall, bond values increase. Movement of interest rates can have a dramatic effect on a bond’s value and presents the typical bondholder with a number of different financial risks that we have described in detail.
Also in this chapter, we have discussed how bond values can be estimated through the use of several different factors. Prevailing interest rates are among the most critical of these, but also important are factors such as maturity periods, the taxability of bond interest, the credit standing of bond issuers, and the likelihood of bond call, or issuers paying off their debt early.
When considering purchasing bonds or any such fixed-income investment, investors should remain aware that interest rates are always in a state of flux and can change at any time. The movements of bond values and bond yields will be significantly affected by these changes and can be favorable or unfavorable for any investor.
10.5
Using Spreadsheets to Solve Bond Problems
Learning Outcomes
By the end of this section, you will be able to:
- Demonstrate bond valuations using Excel.
- Demonstrate bond yield calculations using Excel.
Calculating the Price (Present Value) of a Bond
The following examples illustrate how Microsoft Excel can be used to calculate common bond problems. Please be sure to refer to the chapters on the time value of money for examples of using spreadsheets to solve present value problems, as these same concepts are also used in solving bond problems.
You can use the following steps in Excel to determine the price or present value of a coupon bond. Suppose that a bond has a par or face value of $1,000, pays coupons semiannually at a 4% annual rate, and matures in 15 years. We can assume a YTM rate of 5%.
- First, select Formulas from the Excel upper menu bar, and from the dialog box, select PV (see Figure 10.11).
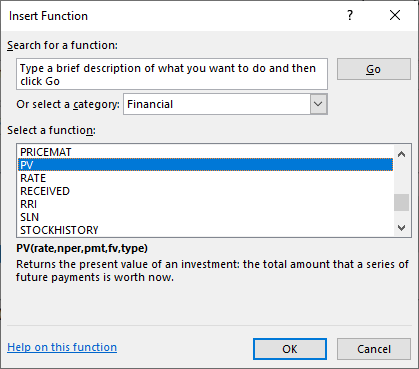
Figure 10.11 Using Excel to Enter a PV (Present Value) Function
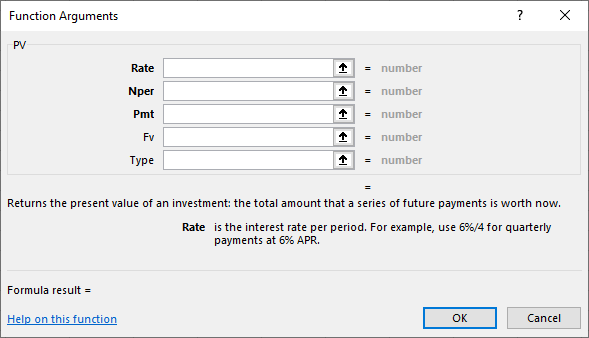 When the PV function is selected, another dialog box will appear (see Figure 10.12). It is here that the function variables, or arguments, will be entered. It is preferable to use cell addresses to refer to these arguments so that the spreadsheet can be easily used again if inputs/arguments change.
Figure 10.12 Function Arguments Dialog Box
- Enter the function inputs or arguments (see Figure 10.13). We refer to the cell addresses as per our example spreadsheet.
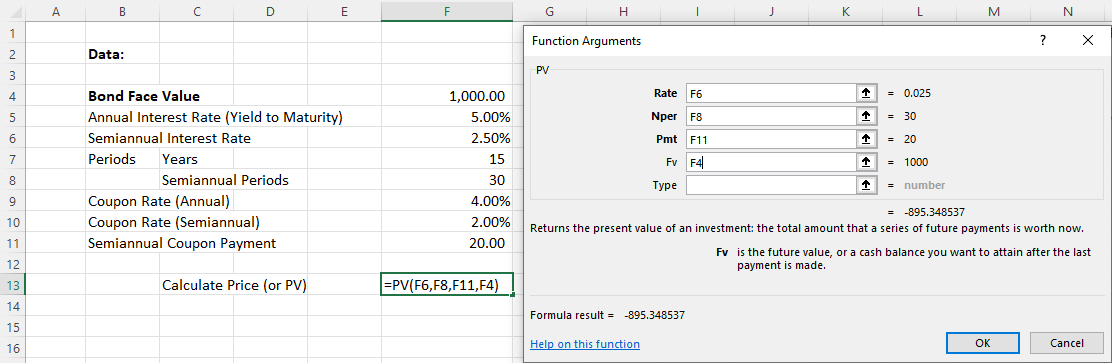
Figure 10.13 Completed Data Entry Menu
Note that the result, the price or present value, will appear in the bottom left section of the Function Arguments box once the arguments are entered. It will appear as a negative value because of the sign convention and because the bond face value in cell F4 was entered as a positive value.
Calculating the Yield to Maturity (Interest Rate) of a Bond
Use the following steps in Excel to determine the YTM (interest rate) of a bond. Assume that you want to find the YTM of a $1,000, 3.5% bond with annual coupon payments that is selling for $675.00 and will mature in 12 years.
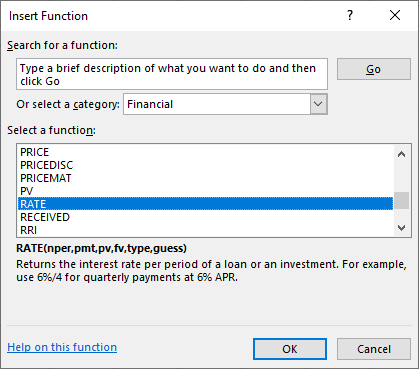 First, select Formulas from the Excel upper menu bar, and from the dialog box, select Rate (see Figure 10.14).
Figure 10.14 Using Excel to Enter a Rate Function
- After the dialog box appears, enter the variables or arguments. As with our earlier example, we will use the preferred method of identifying the arguments with cell addresses (see Figure 10.15).
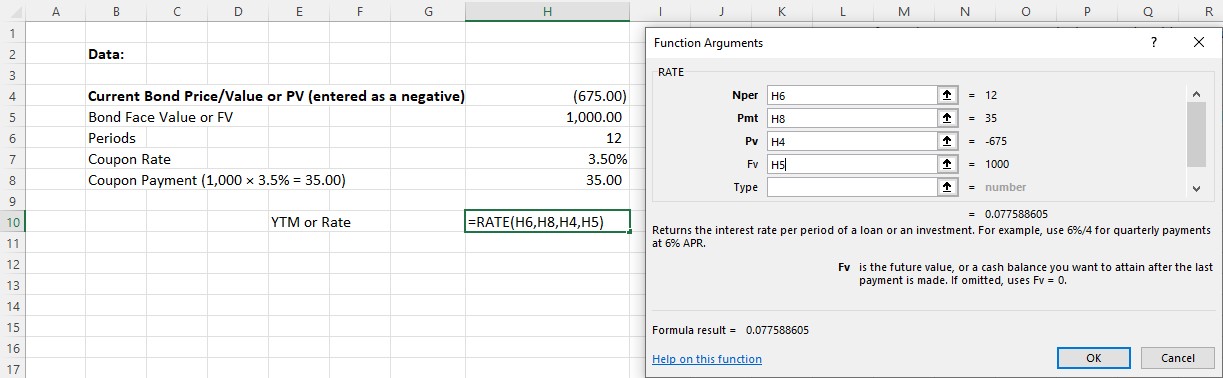
Figure 10.15 Completed Data Entry Menu
- Again, after all arguments are entered through their correct cell references, the answer will appear in the lower left corner of the box. Once satisfied with the result, you can hit Enter to insert this final calculated value in your spreadsheet. This has been set up in this sheet in cell H10.
 THINK IT THROUGHCalculating a Coca-Cola Bond to MaturityEarlier, we covered how a financial calculator could be used to determine the YTM of our Coca-Cola bond example. If we wanted to use an Excel spreadsheet to perform this calculation instead of a calculator, we would set up our spreadsheet as shown in the steps below. The current bond price, entered as a negative, is ($952.06). The bond face value of FV is $1,000; the time period is, or 14 semiannual periods; the coupon rate is, or 0.05%; and the coupon payment is $5.00.1. First, select Formulas from the Excel upper menu bar, and from the dialog box, select Rate (see Figure 10.16).Figure 10.16 Using Excel to Enter a Rate Function
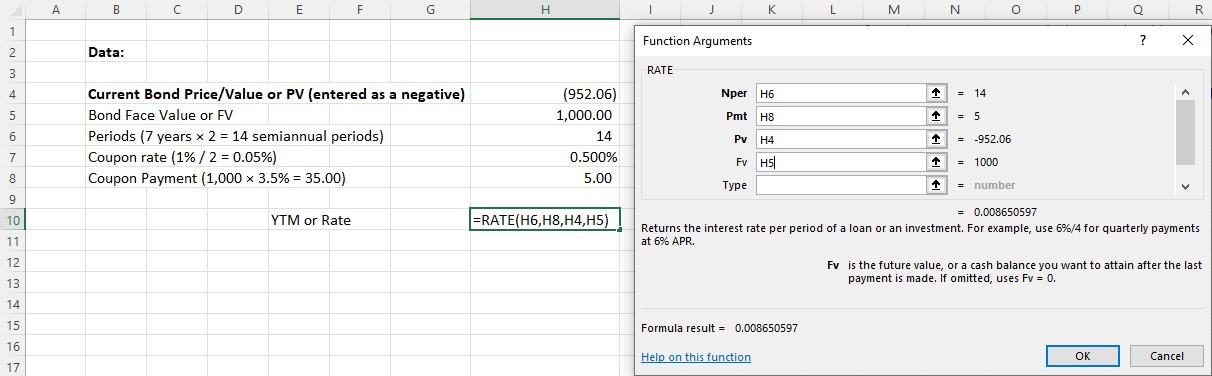 After the dialog box appears, enter the variables or arguments. As with our earlier examples, we will use the preferred method of identifying arguments with cell addresses (see Figure 10.17).Figure 10.17 Completed Data Entry MenuAgain, after all arguments are entered through their correct cell references, the answer will appear in the lower left corner of the box. Once satisfied with the result, you can hit Enter to insert this final calculated value into your spreadsheet. This has been set up in this sheet in cell H10.As noted above, remember that this is a semiannual rate because it was calculated using semiannual coupon payments and periods. To express it as an annual YTM rate, you must multiply it by 2.
Calculating the Maturity Period (Term) of a Bond
You can use the following steps in Excel to determine the maturity period or term of a bond. Assume that you are considering investing in a bond that is selling for $820.00, has a face value of $1,000, and has an annual coupon rate of 3%. If the YTM is 10%, how long will it be until the bond matures?
 First, select Formulas from the Excel upper menu bar, and from the dialog box, select Nper (see Figure 10.18).
Figure 10.18 Using Excel to Calculate Bond Time to Maturity
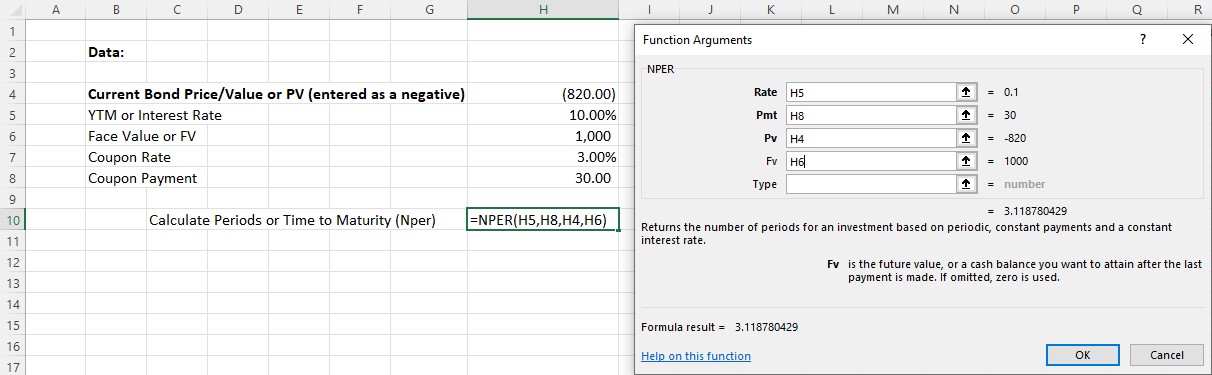 When the dialog box appears, enter function arguments (see Figure 10.19). Once again, we will use the preferred method of using cell addresses as reference points.
Figure 10.19 Completed Data Entry Menu
- When arguments have all been entered, the answer will appear in the lower left of the Function Arguments box, as per the above. We arrive at a final answer of 3.12 years until this bond matures.
Calculating Coupon Rate and Interest (Coupon) Payments
Here is how you would determine the coupon or interest rate and coupon payment using Excel. Assume a
$1,000 face value bond is selling for $595, has 20 years until it matures, and has a YTM of 6.5%. What are the coupon rate and the periodic coupon payment amount of the bond?
 First, select Formulas from the Excel upper menu bar, and from the dialog box, select PMT (see Figure 10.20).
Figure 10.20 Using Excel to Enter a PMT or Payment Function
- When the dialog box appears, enter function arguments. Once again, we will use the preferred method of using cell addresses as reference points (see Figure 10.21).
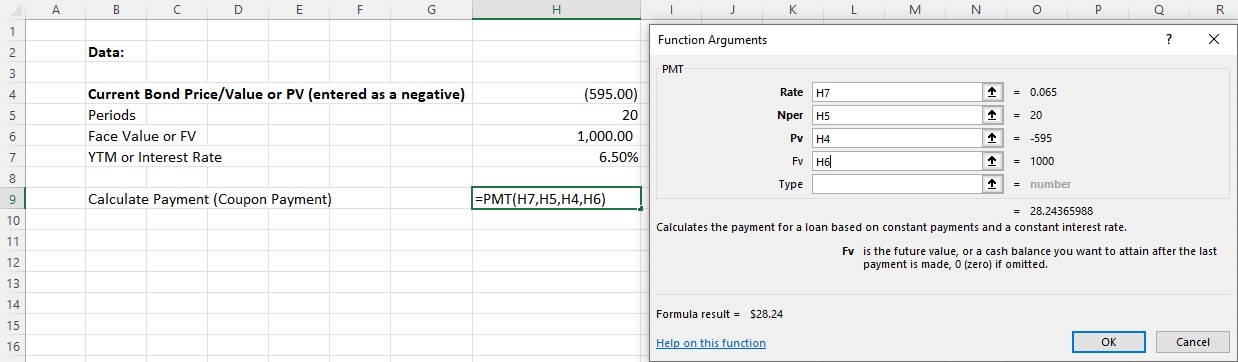
Figure 10.21 Completed Data Entry Menu
- When arguments have all been entered, the answer will appear in the lower left of the Function Arguments box, as per the above. We arrive at a final answer of $28.24 as the coupon payment.
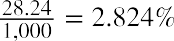
The coupon rate can be calculated by taking this coupon payment amount and dividing it by the face value:
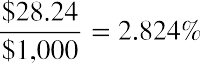
So, the coupon rate is 2.824%.
 Summary
Characteristics of Bonds
Bonds are typically a basic form of investment that entails a straightforward financial agreement between issuer and purchaser. There are three primary categories of bonds: government bonds, corporate bonds, and convertible bonds. These different types of bond vary depending on their issuer, length until maturity, interest rate, and risk.
Bond Valuation
It is important to ascertain what a given bond is worth to a willing buyer and a willing seller. We can price a bond using an equation, a calculator, or a spreadsheet. The essential steps are (1) identify the amount and timing of the future cash flow; (2) determine the discount rate; (3) find the present values of the lump sum principal and the annuity stream of coupons; and (4) add the present value of the lump sum principal and the present value of the coupons.
Using the Yield Curve
When interest rate yields are plotted against their respective maturity periods and these plotted points are connected, the resulting line is called the yield curve. The yield curve is a graphical representation of the term structure of interest rates. A yield curve always shows the value of yields (rates) on the y-axis and maturities or time periods on the x-axis.
Risks of Interest Rates and Default
Because bonds are fixed-income investments, they are subject to a number of risks that could have negative effects on their market value. The most common and best-known risks are interest rate risk and default risk, but there are some others risks that should be understood, such as credit risk, liquidity risk, duration risk, call risk, investment risk, and term risk. To assist potential bond investors in understanding some of these risks, bond ratings have been developed and are regularly published by a number of organizations to express their assessment of the risk quality of various bond issues.
Using Spreadsheets to Solve Bond Problems
Microsoft Excel can be used to solve common bond problems. It can be used to calculate the value of a coupon bond, the yield to maturity (interest rate) of a bond, the maturity period of a bond, and the coupon rate and interest (coupon) payments of a bond.
 Key Terms
bond call a feature of certain bonds or other fixed-income instruments that allows the issuer to repurchase and retire these instruments before maturity
bond price the present, discounted value of the future cash stream generated by a bond; the sum of the present values of all likely coupon payments and the present value of the par value at maturity
bond ratings grades assigned to bonds by rating services that indicate their overall credit quality
Business Cycle Dating Committee a subdivision of the National Bureau of Economic Research (NBER), the US government agency that maintains a chronology of US business cycles
call risk the risk that a bond issuer will redeem a callable bond prior to maturity
capital gains the increase in a capital asset’s value that is realized when the asset is sold
cash rate the interest rate that a central bank, such as the Reserve Bank of Australia or the US Federal Reserve System, will charge commercial banks for loans; also known as the bank rate or the base interest rate
convertible bonds fixed-income corporate debt securities that yield interest payments but can be converted into a predetermined number of common stock or equity shares
coupon payment the periodic dollar value of interest that is paid to a bondholder by the bond issuer
coupon rate the amount of annual interest paid by the bond issuer; is multiplied by the face value of a bond to determine annual interest or coupon payment amounts
credit risk the risk taken by a bond investor that the bond issuer will default by failing to pay interest and repay the principal on schedule
deep discount bonds bonds that sell at significantly lower values than their par values default when an issuer fails to make scheduled interest or principal payments on its bonds default risk the risk taken by investors that payments will be delayed or will not occur
discount bond a bond currently trading for less than its par value in the secondary market; offers a coupon rate that is lower than prevailing interest rates
duration a measure of how much bond prices are likely to change if and when interest rates move duration risk the risk associated with the sensitivity of a bond’s price to a 1% change in interest rates Federal Reserve funds rate (federal funds rate) the target interest rate, set by the Federal Reserve, at
which commercial banks borrow and lend their excess reserves to each other
Federal Reserve System (the Fed) the central banking system of the United States, responsible for administering fiscal policy for the country
fixed-income securities investments that provide a return in the form of fixed, periodic interest payments and the eventual return of principal at maturity; the most common forms are bonds
floating-rate bonds bonds with variable interest rates that allow investors to benefit from rising interest rates
interest income annual interest amounts paid, or coupon payments made, on a bond between its issue date and the date of maturity
interest rate risk the risk of investment losses that result from changes in interest rates
investment grade describes a municipal or corporate bond with a rating that indicates it presents a low risk of default
junk bonds bonds that have been given a low credit rating, below investment grade; riskier than other bonds due to a greater chance that the issuer will default or experience a credit event
liquidity risk risk that stems from the lack of marketability of an investment, meaning that it cannot be bought or sold quickly enough to prevent or minimize a loss
London Interbank Offered Rate (LIBOR) a benchmark interest rate at which major global banks lend to one another in the international interbank market for short-term loans
maturity date the date on which a bondholder ceases to receive interest payments on a bond investment and instead is repaid its par, or face, value
municipal bonds (“munis”) debt securities issued by state and local governments; can be thought of as loans that investors make to local governments to fund infrastructure
par value also called the face amount or face value; the value written on the front of the bond, which is the amount of money that bond issuers promise to be paid at maturity
premium bond a bond that is trading above its par value in the secondary market; offers a coupon rate that is higher than the current prevailing interest rates being offered
prime rate the interest rate that banks charge creditworthy corporate customers; among the most widely used benchmarks for setting home equity lines of credit and credit card rates, based on the federal funds rate set by the Federal Reserve
rating agencies (bond rating services) independent service agencies, such as Fitch, Moody’s, or Standard & Poor’s, that perform the isolated function of credit risk evaluation
realized return the actual return that an investor earns over a given time period through the buying and selling of a security
reinvestment risk the risk that an investor will be unable to reinvest cash flows received from an investment (e.g., coupon payments or interest) at a rate comparable to their current rate of return
savings bonds debt securities purchased by investors, as a personal investments or as gifts, that the US government issues to pay for certain public or government programs
term risk the risk of potentially earning lower returns on longer-term bond holdings compared to those potentially available when making several shorter-term investments over the same period of time
US Treasury bills (T-bills) short-term US government debt obligations backed by the Treasury Department with a maturity of one year or less
US Treasury note rate the interest rate that the US government pays to borrow money for different lengths of time; notes are issued in terms of two, three, five, seven, and 10 years
yield curve a line that plots yields (interest rates) of bonds having equal credit quality but differing maturity dates; gives an idea of future interest rate changes and economic activity
yield to maturity (YTM) the total return anticipated on a bond if the investment is held until maturity
zero-coupon bonds bonds that are issued at a deep discount from face value and offer no interest or coupon payments