5 Lesson 3 Financial Analysis
Financial Analysis
Financial analysis is a crucial element of business, but it can be used in personal finance as well. It differs depending on the role and perspective of those performing the analysis. For example, your personal accountant will have different goals and needs in making recommendations to you about your personal finances. All accounting professionals use financial analysis to check for validity, accurate data, compliance in reporting, and more.
Some tactics for managing your personal finances can be the same as for managing business finances. For example, reducing expenses and maximizing returns on long-term investments are always good practices. Debt can also be a beneficial tool in both personal and professional finances when used appropriately. Debt is neither inherently good nor bad; it simply needs to be properly managed in order to achieve a reasonable return in exchange for the cost and risk it poses.
Though the process and tools may be similar, financial analysis from a business perspective has different goals and needs. Investors are looking to identify firm performance, financial health, and profitability. Financial analysts closely review information found on financial statements so they can make informed business decisions. The income statement, statement of retained earnings, balance sheet, and statement of cash flows, among other financial information, are analyzed for internal and external stakeholders and provide a company with valuable information about its overall performance and specific areas for improvement. The analysis can
help with budgeting and making decisions about where the company could cut costs, how it might increase revenues, and what capital investment opportunities it should pursue.
LINK TO LEARNINGFinancial AnalystLots of individuals and companies perform financial analysis. One of these roles is that of a financial analyst. The skills and qualifications of a financial analyst vary widely from one industry to another, but there are a number of similarities in individuals who hold these roles. As you watch the video about financial analysts (https://openstax.org/r/video-about-financial-analysts), consider your own career path and how your skills, abilities, and interests may fit this role.
 6.1
6.1
Ratios: Condensing Information into Smaller Pieces
By the end of this section, you will be able to:
- Explain the importance of financial statement analysis in making informed decisions about business opportunities.
- Outline the limitations of financial statement analysis in making investment decisions.
When considering the outcomes from analysis, it is important for a company to understand that the data generated needs to be compared to similar data within the industry at large as well as that of close competitors. The company should also consider its past experience and how it corresponds to current and future performance expectations.
Importance of Ratios and Analysis
Financial ratios help internal and external stakeholders make informed decisions about actions like investing, becoming a supplier, making a loan, or altering internal operations, among other things. The information resulting from ratio analysis can be used to examine trends in performance, establish benchmarks for success, set budget expectations, and compare industry competitors. There are four main types of ratios: liquidity, solvency, efficiency, and profitability. While outcomes for some ratios may seem more ideal, the industry in which the business operates can change the influence of these outcomes on stakeholder decisions.
There are several benefits to analyzing financial statements. The information can show trends over time, which can help in making future business decisions. Converting information to percentages or ratios eliminates some of the disparities between competitors’ sizes and operating abilities, making it easier for stakeholders to make informed decisions. It can assist with understanding the makeup of current operations within the business and which shifts need to occur internally to increase productivity.
Limitation of Financial Statement Analysis
Though useful, it’s important to note that there are limitations to financial statement analysis as well. Stakeholders need to remember that past performance does not always predict future performance. Economic influences, such as inflation or a recession, could skew the data being analyzed. Additionally, the way a company reports information may change over time. For example, there could be changes in where and when certain transactions are recorded, and this may not be immediately evident to financial statement users. It is also key to note that though all publicly traded companies in the United States are required to follow Generally Accepted Accounting Principles (GAAP), there are many estimates and flexibility in how some standards are applied. This means that firms can still follow accounting standards appropriately but present some information differently from other firms.
It makes good sense for a company to use financial statement analysis to guide future operations so it can
budget properly, control costs, increase revenues, and make long-term expenditure decisions. As long as stakeholders understand the limitations of financial statement analysis, it is a useful way to predict growth and financial strength.
Despite limitations, ratios are still a valuable tool if used appropriately. The next section discusses several operating efficiency ratios including accounts receivable turnover, total asset turnover, inventory turnover, and days’ sales in inventory. Operating efficiency ratios help users see how well management is using the financial assets of the firm.
6.2
Operating Efficiency Ratios
By the end of this section, you will be able to:
- Calculate accounts receivable turnover to assess a firm’s performance in managing customer receivables.
- Evaluate management’s use of assets using total asset turnover and inventory turnover.
- Assess organizational performance using days’ sales in inventory calculations.
Efficiency ratios show how well a company uses and manages its assets, one key element of financial health. Important areas of efficiency are the management of sales, accounts receivable, and inventory. A company that is efficient will usually be able to generate revenues quickly using the assets it has acquired. Let’s examine four efficiency ratios: accounts receivable turnover, total asset turnover, inventory turnover, and days’ sales in inventory.
Accounts Receivable Turnover
For our discussion of financial statement analysis, we will look at Clear Lake Sporting Goods. Clear Lake Sporting Goods is a small merchandising company (a company that buys finished goods and sells them to consumers) that sells hunting and fishing gear. Figure 6.2 shows the comparative income statements and balance sheets for the past two years.
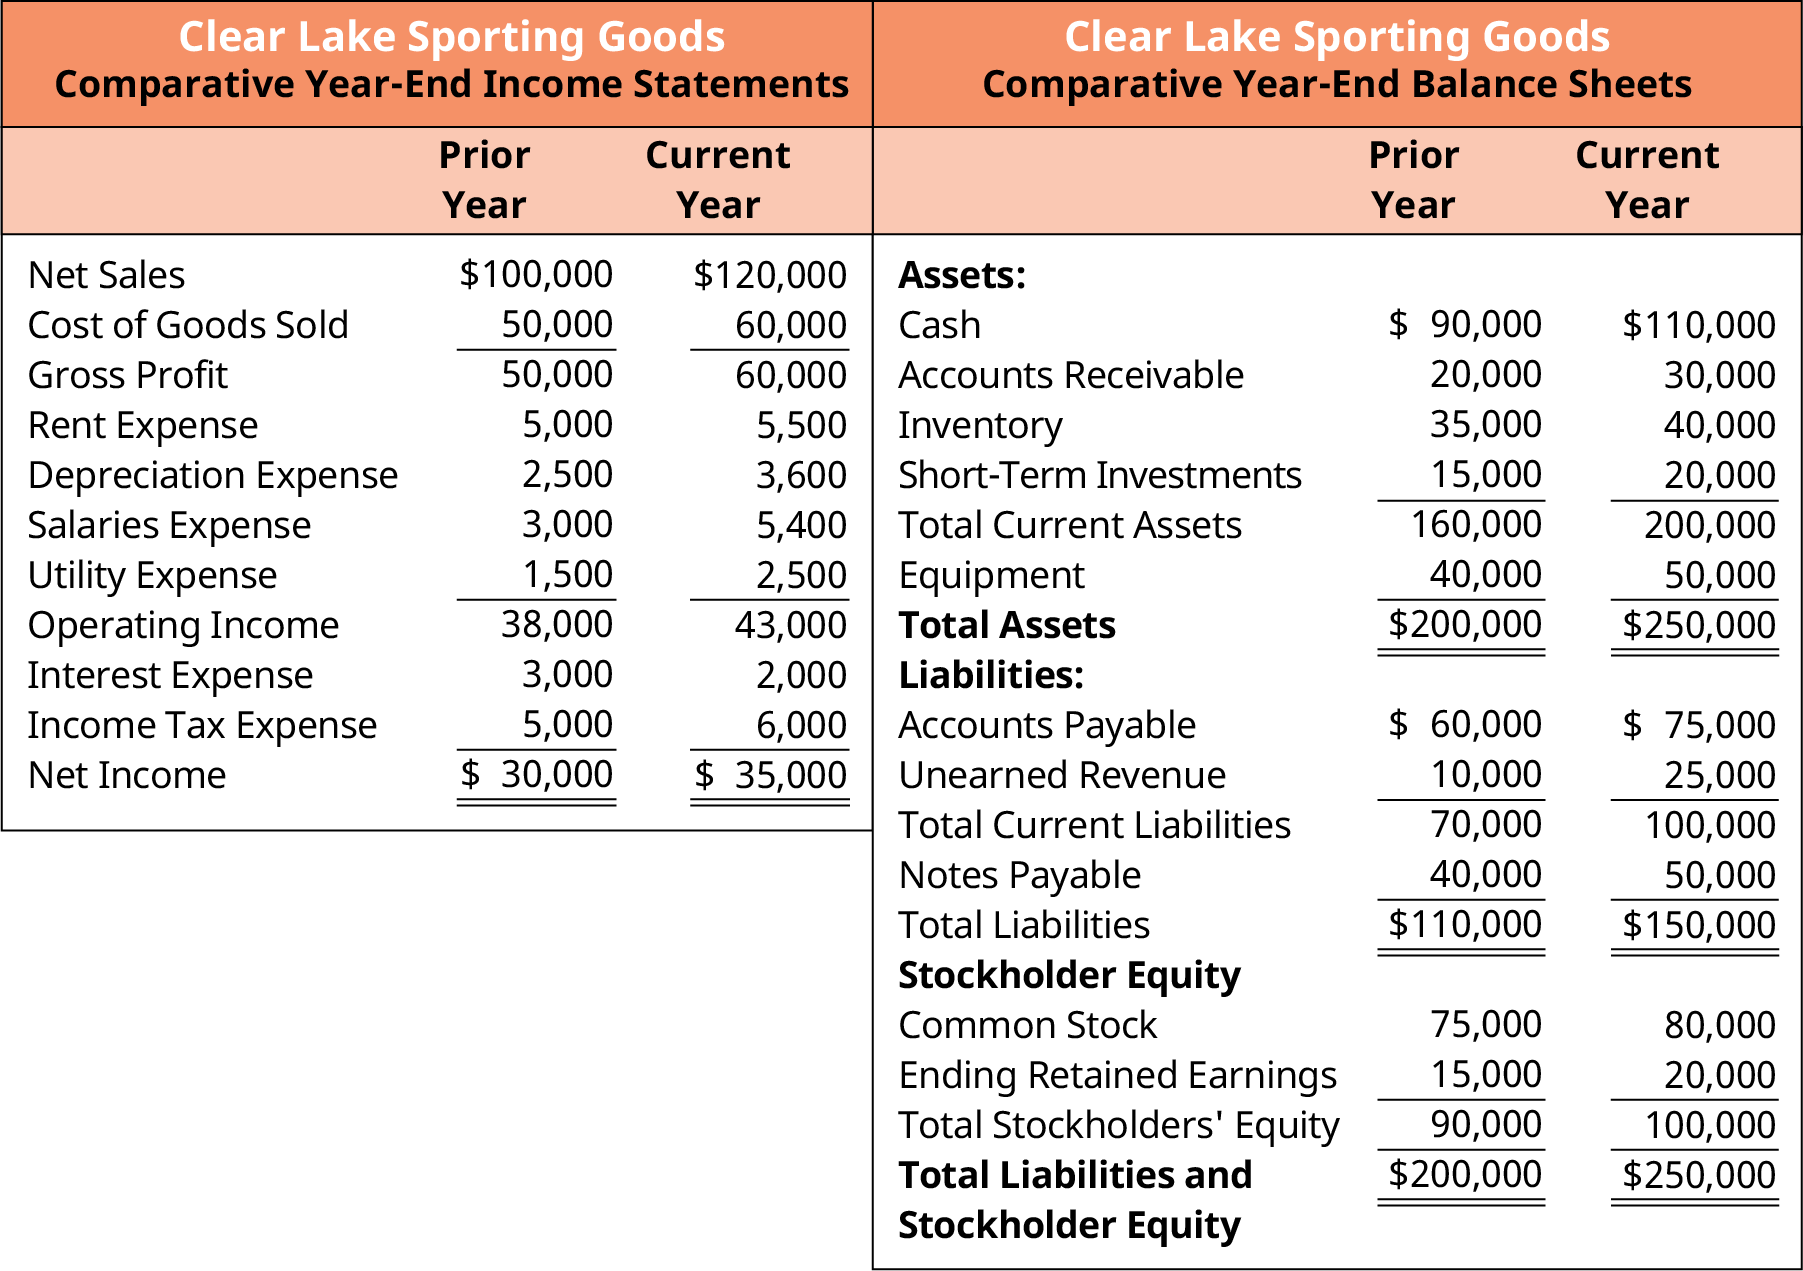
Figure 6.2 Comparative Income Statements and Year-End Balance Sheets Note that the comparative income statements and
balance sheets have been simplified here and do not fully reflect all possible company accounts.
To begin an analysis of receivables, it’s important to first understand the cycles and periods used in the calculations.
Operating Cycle
A period is one operating cycle of a business. The operating cycle includes the cash conversion cycle plus the accounts receivable cycle (discussed below). Essentially it is the time it takes a business to purchase or make inventory and then sell it. For example, assume Clear Lake Sporting Goods orders and receives a shipment of fishing lures on June 1. It stocks the shelves with lures and tracks its inventory and sales. By July 15, all the lures from that shipment are gone. In this example, Clear Lake’s operating cycle is 45 days.
Cash Conversion Cycle
Cash, however, doesn’t necessarily flow linearly with accounting periods or operating cycles. The cash conversion cycle is the time it takes to spend cash to purchase inventory, produce the product, sell it, and then collect cash from the customer. Accounts receivable is one section of that cycle. Referring to Clear Lake’s June 1 shipment of lures that sold by July 15, assume that some of the customers were fishing guides that keep an open account with Clear Lake. This company did not pay for its lures until August 15 when it settled its account. In this example, Clear Lake’s cash cycle is 75 days.
Let’s take a look at the accounts receivable turnover ratio, which helps assess that element of the cash conversion cycle.
Accounts Receivable Turnover Ratio
Receivables ratios show company performance in relation to current receivables (what is due from customers), as well as credit policy effect on sales growth. One receivables ratio is called the accounts receivable turnover ratio.This ratio determines how many times (i.e., how often) accounts receivable are collected during a year and converted to cash. A higher number of times indicates that receivables are collected quickly. This quick cash collection may be viewed as a positive occurrence because liquidity improves, and the company may reinvest in its business sooner when the value of the dollar has more buying power (time value of money). The higher number of times may also be a negative occurrence, signaling that credit extension terms are too tight, and it may exclude qualified consumers from purchasing. Excluding these customers means that they may take their business to a competitor, thus reducing potential sales.
In contrast, a lower number of times indicates that receivables are collected at a slower rate. A slower collection rate could signal that lending terms are too lenient; management might consider tightening lending opportunities and more aggressively pursuing payment from its customers. The lower turnover also shows that the company has cash tied up in receivables longer, thus hindering its ability to reinvest this cash in other current projects. The lower turnover rate may signal a high level of bad debt accounts. The determination of a high or low turnover rate really depends on the standards of the company’s industry. It’s key to note the tradeoff in adjusting credit terms. Loose credit terms may attract more customers but may also increase bad debt expense. Tighter credit terms may attract fewer customers but may also reduce bad debt expense.
The formula for accounts receivable turnover is

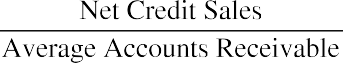

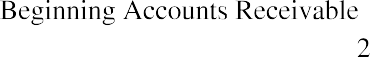
Net credit sales are sales made on credit only; cash sales are not included because they do not produce receivables. However, many companies do not report credit sales separately from cash sales, so “net sales” may be substituted for “net credit sales” in this case. Beginning and ending accounts receivable refer to the
beginning and ending balances in accounts receivable for the period. The beginning accounts receivable balance is the same figure as the ending accounts receivable balance from the prior period.
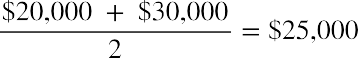
When computing the accounts receivable turnover for Clear Lake Sporting Goods, let’s assume net credit sales make up $100,000 of the $120,000 of the net sales found on the income statement in the current year.


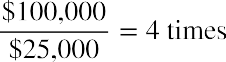
To gain a better understanding of its ratio performance, Clear Lake Sporting Goods can compare its turnover to industry averages, key competitors, and its own historical ratios. Given this outcome, the managers may want to consider stricter credit lending practices to make sure credit customers are of a higher quality. They may also need to be more aggressive with collecting any outstanding accounts.
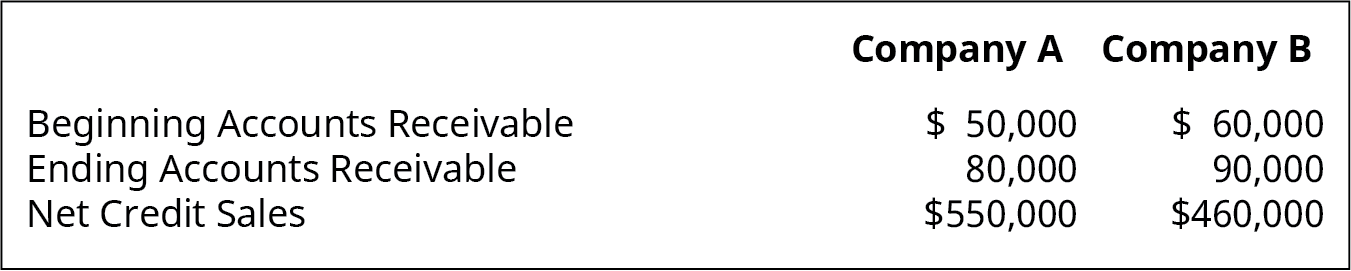 THINK IT THROUGHAccounts Receivable TurnoverYou are a consultant assessing cash management practices for two firms, Company A and Company B (see Figure 6.3).Figure 6.3 Financial Information for Company A and Company BBased on the information provided, do the following:Compute the accounts receivable turnover ratio.Interpret the outcomes, indicating how each company is performingSolution:Company A:times, Company B:times. Upon initial review of this limited information, Company A seems to be performing better since its turnover ratio is higher. Accounts receivable turnover has a significant impact on cash flows. One might want more information on trends for each company with these ratios and a comparison to others in the same industry. More information is helpful in assessing performance.
LINK TO LEARNINGAmerican Superconductor CorporationAmerican Superconductor Corporation specializes in the production and service of energy-efficient wind turbine systems, as well as energy grid construction solutions. On the company’s 2019 financial statement (https://openstax.org/r/financial-statement), the accounts receivable turnover ratio is approximately 6.32 times.
Total Asset Turnover
Total asset turnover measures the ability of a company to use its assets to generate revenues. A company would like to use as few assets as possible to generate the most net sales. Therefore, a higher total asset turnover means the company is using their assets very efficiently to produce net sales. The formula for total asset turnover is

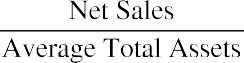

Average total assets are found by dividing the sum of beginning and ending total assets balances found on the balance sheet. The beginning total assets balance in the current year is taken from the ending total assets balance in the prior year.
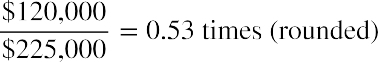
Clear Lake Sporting Goods’ total asset turnover is


The outcome of 0.53 means that for every $1 of assets, $0.53 of net sales are generated. Over time, Clear Lake Sporting Goods would like to see this turnover ratio increase.
Inventory Turnover
Inventory turnover measures how many times during the year a company has sold and replaced inventory. This can tell a company how well inventory is managed. A higher ratio is preferable; however, an extremely high turnover may mean that the company does not have enough inventory available to meet demand. A low turnover may mean the company has too much supply of inventory on hand. The formula for inventory turnover is
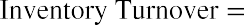
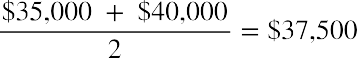
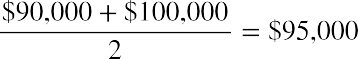
Cost of goods sold for the current year is found on the income statement. Average inventory is found by dividing the sum of beginning and ending inventory balances found on the balance sheet. The beginning inventory balance in the current year is taken from the ending inventory balance in the prior year.
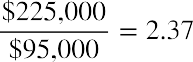
Clear Lake Sporting Goods’ inventory turnover is


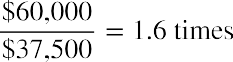
A ratio of 1.6 times seems to be a very low turnover rate for Clear Lake Sporting Goods. This may mean the company is maintaining too high an inventory supply to meet a low demand from customers. Managers may want to decrease their on-hand inventory to free up more liquid assets to use in other ways. Keep in mind, ratios should not be taken out of context. One ratio alone can’t tell the whole story. Ratios should be used with caution and in conjunction with other ratios and additional financial and contextual information.
As with accounts receivable, there is a trade-off to consider in managing inventory. Low turnover will usually
mean a low risk of stockouts and the ability to carry more of what customers are looking for. But high inventory levels will mean that more cash is tied up in inventory. High turnover will mean carrying less inventory and the higher risk of stockouts, causing customers to go elsewhere to find what they need.

Figure 6.4 Inventory turnover can help determine how well a company manages its inventory. (credit: “Untitled” by Marcin Wichary/ flickr, CC BY 2.0)
LINK TO LEARNINGTarget CorporationAs we have learned, the inventory turnover ratio shows how well a company manages its inventory. Look through the financial statements in the 2019 Annual Report for Target (https://openstax.org/r/annual- report-for-target) and calculate the inventory turnover ratio. What does the outcome mean for Target?
Days’ Sales in Inventory
Days’ sales in inventory expresses the number of days it takes a company to turn inventory into sales. The fewer the number of days, the more quickly the company can sell its inventory. The greater the number of days, the longer it takes to sell its inventory. The formula for days’ sales in inventory is


Clear Lake Sporting Goods’ days’ sales in inventory is


Depending on the industry, 243 days may be a long time to sell inventory. While industry dictates what is an acceptable number of days to sell inventory, 243 days is likely to be unsustainable long-term. Remember, it’s important to not take one ratio out of context. Review the ratio in conjunction with other ratios and other financial data. For example, we might review the days’ sales in inventory along with accounts receivable turnover for Clear Lake Sporting Goods relative to the industry average to get a better picture of Clear Lake’s performance in this area.
6.3
Liquidity Ratios
By the end of this section, you will be able to:
- Calculate current, quick, and cash ratios to assess a firm’s liquidity and make informed business decisions.
- Assess organizational performance using liquidity ratios.
Liquidity refers to the business’s ability to manage current assets or convert assets into cash in order to meet short-term cash needs, another aspect of a firm’s financial health. Examples of the most liquid assets include cash, accounts receivable, and inventory for merchandising or manufacturing businesses. The reason these are among the most liquid assets is that these assets will be turned into cash more quickly than land or buildings, for example. Accounts receivable represents goods or services that have already been sold and will typically be paid/collected within 30 to 45 days.
Inventory is less liquid than accounts receivable because the product must first be sold before it generates cash (either through a cash sale or sale on account). Inventory is, however, more liquid than land or buildings because, under most circumstances, it is easier and quicker for a business to find someone to purchase its goods than it is to find a buyer for land or buildings.
Current Ratio
The current ratio is closely related to working capital; it represents the current assets divided by current liabilities. The current ratio utilizes the same amounts as working capital (current assets and current liabilities) but presents the amount in ratio, rather than dollar, form. That is, the current ratio is defined as current assets/current liabilities. The interpretation of the current ratio is similar to working capital. A ratio of greater than one indicates that the firm has the ability to meet short-term obligations with a buffer, while a ratio of less than one indicates that the firm should pay close attention to the composition of its current assets as well as the timing of the current liabilities.

The current ratio in the current year for Clear Lake Sporting Goods is


A 2:1 ratio means the company has twice as many current assets as current liabilities; typically, this would be plenty to cover obligations. A 2:1 ratio is actually quite high for most companies and most industries. Again, it’s recommended that ratios be used in conjunction with one another. An analyst would likely look at the high current ratio and low accounts receivable turnover to begin asking questions about management performance, as this might indicate a trouble area (high inventory and slow collections).
LINK TO LEARNINGTarget CorporationAs we have learned, the current ratio shows how well a company can cover short-term liabilities with short- term assets. Look through the balance sheet in the 2019 Annual Report for Target (https://openstax.org/r/ annual-report-for-target) and calculate the current ratio. What does the outcome mean for Target?
Quick Ratio
The quick ratio, also known as the acid-test ratio, is similar to the current ratio except current assets are more narrowly defined as the most liquid assets, which exclude inventory and prepaid expenses. The conversion of

inventory and prepaid expenses to cash can sometimes take more time than the liquidation of other current assets. A company will want to know what it has on hand and can use quickly if an immediate obligation is due. The formula for the quick ratio is


The quick ratio for Clear Lake Sporting Goods in the current year is

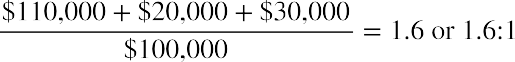
A 1.6:1 ratio means the company has enough quick assets to cover current liabilities. It’s again key to note that a single ratio shouldn’t be used out of context. A 1.6 ratio is difficult to interpret on its own. Industry averages and trend analysis for Clear Lake Sporting Goods would also be helpful in giving the ratio more meaning.
LINK TO LEARNINGTarget CorporationAs we have learned, the quick ratio shows how quickly a company can liquidate current assets to cover current liabilities. Look through the financial statements in the 2019 Annual Report for Target (https://openstax.org/r/annual-report-for-target) and calculate the quick ratio. What does the outcome mean for Target?
Cash Ratio
Cash is the most liquid asset a company has, and cash ratio is often used by investors and lenders to asses an organization’s liquidity. It represents the firm’s cash and cash equivalents divided by current liabilities and is a more conservative look at a firm’s liquidity than the current or quick ratios. The ratio is reflected as a number, not a percentage. A cash ratio of 1.0 means the firm has enough cash to cover all current liabilities if something happened and it was required to pay all current debts immediately. A ratio of less than 1.0 means the firm has more current liabilities than it has cash on hand. A ratio of more than 1.0 means it has enough cash on hand to pay all current liabilities and still have cash left over. While a ratio greater than 1.0 may sound ideal, it’s important to consider the specifics of the company. Sitting on idle cash is not ideal, as the cash could be used to earn a return. And having a ratio less than 1.0 isn’t always bad, as many firms operate quite successfully with a ratio of less than 1.0. Comparing the company ratio with trend analysis and with industry averages will help provide more insight.

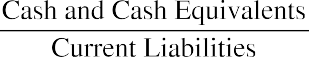
The cash ratio for Clear Lake Sporting Goods in the current year is:

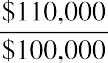
A 1.1 ratio means the company has enough cash to cover current liabilities.

Figure 6.5 Cash is the most liquid asset a company has and is often used by investors and lenders to assess an organization’s liquidity. (credit: “20 US Dollar” by Jack Sem/flickr CC BY 2.0)
6.4
Solvency Ratios
By the end of this section, you will be able to:
- Evaluate organizational solvency using the debt-to-assets and debt-to-equity ratios.
- Calculate the times interest earned ratio to assess a firm’s ability to cover interest expense on debt as it comes due.
Solvency implies that a company can meet its long-term obligations and will likely stay in business in the future. Meeting long-term obligations includes the ability to pay any interest incurred on long-term debt. Two main solvency ratios are the debt-to-equity ratio and the times interest earned ratio.
Debt-to-Assets Ratio
The debt-to-assets ratio shows the relationship between debt and assets. It reflects how much of the assets of the business was financed through debt. It reflects the company’s leverage and is helpful to analysts in comparing how leveraged one company is compared to another.
Debts normally carry interest expense and must be repaid. The debt-to-assets ratio includes all debt—both long-term debt and current liabilities. The formula for the debt-to-assets ratio is


The information needed to compute the debt-to-assets ratio for Clear Lake Sporting Goods in the current year can be found on the balance sheet. The debt-to-assets ratio for Clear Lake Sporting Goods in the current year is

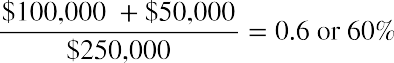
This means that 60 percent of Clear Lake’s assets are financed by debt. We can also then infer that the other 40 percent is financed by equity. A ratio higher than 1.0 means the company has more debts than assets, which means it has negative equity. In Clear Lake’s case, a 60 percent debt-to-assets ratio indicates some risk, but perhaps not a high risk. Comparing Clear Lake’s ratio to industry averages would provide better insight.
LINK TO LEARNINGTarget CorporationAs we have learned, the debt-to-assets ratio shows the relationship between a firm’s debt and assets. Look through the financial statements in the 2019 Annual Report for Target (https://openstax.org/r/annual- report-for-target) and calculate the debt-to-assets ratio. What does the outcome mean for Target?
Debt-to-Equity Ratio
The debt-to-equity ratio shows the relationship between debt and equity as it relates to business financing. A company can take out loans, issue stock, and retain earnings to be used in future periods to keep operations running. A key difference in debt and equity is the interest expense repayment that a loan carries as opposed to equity, which does not have this requirement. Therefore, a company wants to know how much debt and equity contribute to its financing. The formula for the debt-to-equity ratio is

The information needed to compute the debt-to-equity ratio for Clear Lake Sporting Goods in the current year can be found on the balance sheet.

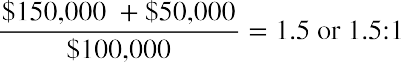
This means that for every one dollar of equity contributed toward financing, $1.50 is contributed from lenders. Recall that total assets equal total liabilities plus total equity. Both the debt-to-assets and debt-to-equity ratio have total liabilities in the numerator. The difference in the two ratios is the denominator. The denominator for the debt-to-equity ratio is total stockholder equity. The denominator for the debt-to-assets ratio is total assets, or total liabilities plus total equity. Thus, the two ratios contain the same information, making calculating both ratios redundant. A financial analyst may prefer to calculate one ratio over the other because of the format of readily available industry data to use for comparison purposes or for consistency with other calculations the analyst is performing.
 THINK IT THROUGHFinancing a Business ExpansionYou are the CFO of a small corporation. The president, who is one of five shareholders, has created an innovative new product that is testing well with substantial demand. To begin manufacturing, $400,000 is needed to acquire the equipment. The corporation’s balance sheet shows total assets of $2,400,000 and total liabilities of $600,000. Most of the liabilities relate to debt that carries a covenant requiring that the company maintain a debt-to-equity ratio not exceeding 0.50. Determine the effect that each of the two options of obtaining additional capital will have on the debt covenant.Solution:We know the total liabilities for the firm to be $600,000. Using the accounting equation, we can find that the firm has $1,800,000 in equity.current debt-to-equity ratio of 0.33, which is well below the requirement for the debt covenant. If the firm issues debt, the ratio changes to, which is 0.55 and would violate the debt covenant. If the firm chooses to issue additional stock, the new debt-to-equity ratio would be, which is 0.27. This is well below the requirements in the debt covenant.
Times Interest Earned (TIE) Ratio
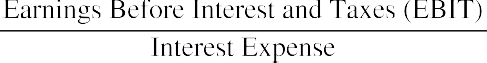
The times interest earned (TIE) ratio measures the company’s ability to pay interest expense on all debt incurred. This ability to pay is determined by the available earnings before interest and taxes (EBIT) are deducted. These earnings are considered the operating income. Lenders will pay attention to this ratio before extending credit. The more times over a company can cover interest, the more likely a lender will extend long- term credit. The formula for times interest earned is

The information needed to compute times interest earned for Clear Lake Sporting Goods in the current year can be found on the income statement.

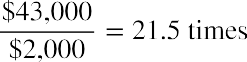
The $43,000 is the operating income, representing earnings before interest and taxes. The 21.5 times outcome suggests that Clear Lake Sporting Goods can easily repay interest on an outstanding loan and creditors would have little risk that Clear Lake Sporting Goods would be unable to pay.
LINK TO LEARNINGTimes Interest EarnedThis video about times interest earned (https://openstax.org/r/video-about-times) explains how to calculate it and why the ratio is useful, and it provides an example.
6.5
Market Value Ratios
By the end of this section, you will be able to:
- Calculate earnings per share to determine the portion of profit allocated to each outstanding share of common stock.
- Evaluate firm value using the price/earnings ratio and book value per share.
In this section we will turn our attention to market value ratios, measures used to assess a firm’s overall market price. Common ratios used include earnings per share, the price/earnings ratio, and book value per share.
Earnings per Share (EPS)
Earnings per share (EPS) measures the portion of a corporation’s profit allocated to each outstanding share of common stock. An increasing earnings per share can drive up a stock price. Conversely, falling earnings per share can lower a stock’s market price. Earnings per share is also a component in calculating the price-to- earnings ratio (the market price of the stock divided by its earnings per share), which many investors find to be a key indicator of the value of a company’s stock.
It’s key to note, however, that EPS, like any ratio, should be used with caution and in tandem with other ratios and contextual data. Many financial professionals choose not to rely on income statement data and, similarly, EPS because they feel the cash flow statement provides more reliable and insightful information.
CONCEPTS IN PRACTICEAlibaba Group Earnings Announcements Continue to Exceed Market ExpectationsAlibaba, a Chinese-based company traded in the United States, exceeded market expectations in 2020 quarterly earnings releases. In the November 2020 earnings release, Alibaba reported earnings per share of17.97 yuan versus market estimates of 14.33. Despite many companies struggling due to the pandemic, Alibaba reported strong earnings as a result of the surge in online shopping and remote work.(sources: “Alibaba Beats Estimates as Pandemic Fuels Online, Cloud Computing Demand.” CNBC. August 20, 2020. https://www.cnbc.com/2020/08/20/alibaba-beats-quarterly-revenue-estimates.html; Emily Bary. “Alibaba Earnings Top Expectations as Pandemic Drives Increased Digital Purchases. Market Watch. August 20, 2020. https://www.marketwatch.com/story/alibaba-earnings-top-expectations-as-pandemic-drives- increased-digital-purchases-2020-08-20; Matthew Johnston. “Alibaba Earnings: What Happened.” Investopedia. November 5, 2020. https://www.investopedia.com/alibaba-q2-2021-earnings-5085444; Chris Versace. “Why S&P 500 EPS Expectations Showcase the Need for Thematic Investing.” Tematica Research. June 3, 2020. https://www.tematicaresearch.com/why-sp-500-eps-expectations-showcase-the-need-for- thematic-investing)
Calculating Earnings per Share


 Earnings per share is the profit a company earns for each of its outstanding common shares. Both the balance sheet and income statement are needed to calculate earnings per share. The balance sheet provides details on the preferred dividend rate, the total par value of the preferred stock, and the number of common shares outstanding. The income statement indicates the net income for the period. The formula to calculate basic earnings per share is
By removing the preferred dividends from net income, the numerator represents the profit available to common shareholders. Because preferred dividends represent the amount of net income to be distributed to preferred shareholders, this portion of the income is obviously not available for common shareholders. While a number of variations of measuring a company’s profit, such as NOPAT (net operating profit after taxes) and EBITDA (earnings before interest, taxes, depreciation, and amortization), are used in the financial world, GAAP requires companies to calculate earnings per share based on a corporation’s net income, as this amount appears directly on a company’s income statement, which for public companies must be audited.
In the denominator, only common shares are used to determine earnings per share because earnings per share is a measure of earnings for each common share of stock. The denominator can fluctuate throughout the year as a company issues and buys back shares of its own stock. The weighted average number of shares is used on the denominator because of this fluctuation. To illustrate, assume that a corporation began the year with 600 shares of common stock outstanding and then on April 1 issued 1,000 more shares. During the period January 1 to March 31, the company had the original 600 shares outstanding. Once the new shares were issued, the company had the original 600 plus the new 1,000 shares, for a total of 1,600 shares for each of the next nine months—from April 1 to December 31. To determine the weighted average shares, apply these fractional weights to both of the stock amounts (see Figure 6.6).
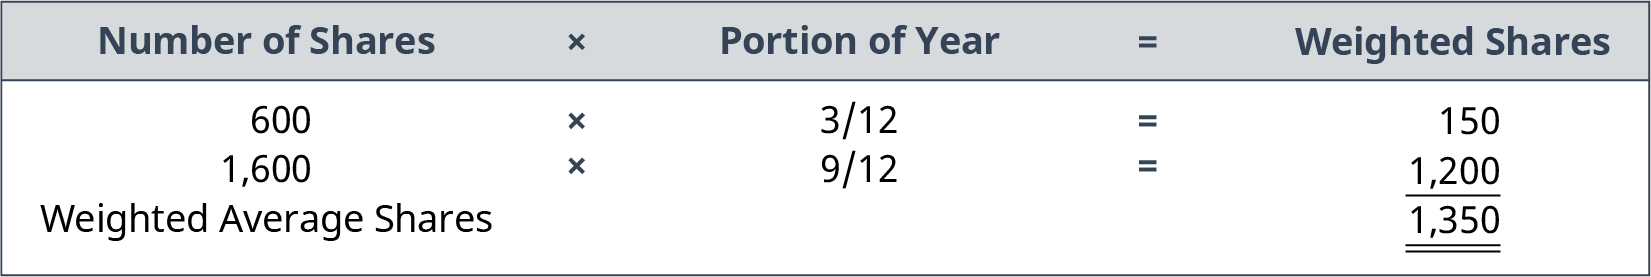
If the shares were not weighted, the calculation would not consider the time period during which the shares were outstanding.
To illustrate how earnings per share is calculated, assume Clear Lake Sporting Goods earns $35,000 in net income during the current year. During the year, the company also declared a $5,000 dividend on preferred stock and a $6,000 dividend on common stock. The company had 8,000 common shares outstanding the entire year. Clear Lake Sporting Goods has generated $3.75 of earnings ($35,000 less the $5,000 of preferred dividends) for each of the 8,000 common shares of stock it has outstanding.


Measuring Performance with Earnings per Share
Earnings per share is a key profitability measure that both current and potential common stockholders monitor. Its importance is accentuated by the fact that GAAP requires public companies to report earnings per share on the face of a company’s income statement. This is the only ratio that requires such prominent reporting. If fact, public companies are required to report two different earnings per share amounts on their income statements—basic and diluted. We’ve illustrated the calculation of basic earnings per share. Diluted earnings per share, which is not demonstrated here, involves the consideration of all securities, such as stocks and bonds, that could potentially dilute, or reduce, the basic earnings per share.
LINK TO LEARNINGFinding Earning per Share for Public CompaniesWhere can you find earnings per share information on public companies? Use the Yahoo! Finance HYPERLINK “https://openstax.org/r/yahoo-finance” \h(https://openstax.org/r/yahoo-finance) website to look up stock and earnings per share data for Tellurian Inc. (TELL), Amazon (AMZN), or CVS Pharmacy (CVS). Or use the search function to search for earnings per share data for your favorite corporation. Enter the ticker for the company you are looking up, and a basic chart and graph will display with stock price data along with several commonly used ratios (including earnings per share).As you review data, keep in mind that a company can manipulate or impact its earnings per share by issuing new shares or buying back issued shares. What are the ethical implications of earnings per share calculations?
Common stock shares are normally purchased by investors to generate income through dividends or to sell at a profit in the future. Investors realize that inadequate earnings per share can result in poor or inconsistent dividend payments and fluctuating stock prices. As such, companies seek to produce earnings per share amounts that rise each period. However, an increase in earnings per share may not always reflect favorable performance, as there are multiple reasons that earnings per share may increase. One way earnings per share can increase is through increased net income. On the other hand, it can also increase when a company buys back its own shares of stock.
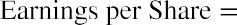
For example, assume that Clear Lake Sporting Goods generated net income of $30,000 and paid out $3,000 in
preferred shareholder dividends last year. In addition, 10,550 shares of common stock were outstanding throughout the entire year. In January of the current year, the company buys back shares of its common stock and holds them as treasury shares, making its current weighted average shares outstanding for this year 8,000. Net income for the current year is $35,000, $5,000 of which was paid to preferred shareholders in dividends. In the prior year, the company’s earnings per share was
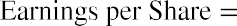
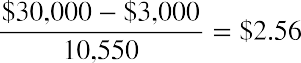
Clear Lake Sporting Goods’ current year earnings per share is
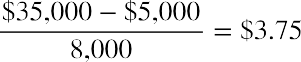
The purchase of treasury stock in the current year reduces the common shares outstanding to 8,000 because treasury shares are considered issued but not outstanding. Earnings per share for the current year is now
$3.75 per share even though earnings only increased by $5,000. It’s key to note the impact of purchasing treasury stock and the intentions in doing so. Treasury stock is commonly purchased for a variety of reasons, but doing so to intentionally manipulate earnings per should not be a primary reason.
This increase in earnings per share occurred because the net income is now spread over fewer shares of stock. Similarly, earnings per share can decline even when a company’s net income increases if the number of shares increases at a higher degree than net income.
CONCEPTS IN PRACTICEStock Buybacks Can Drive Up Earnings per Share: Ethical?As many companies struggled to make ends meet or meet their cash flow needs amid the COVID-19 pandemic, some companies continued to thrive. Apple continued to have a healthy financial position with ample cash supply. It repurchased $18.5 billion of its own stock in the second quarter of 2020.1 The total stock buyback over the preceding five years was $282.87 billion, which is 3.5 times higher than any other company. Since the earnings per share calculation is earnings divided by average outstanding shares, the fewer shares there are outstanding, the higher earnings per share goes without the firm having to actually raise earnings.What do you think? Did Apple act ethically in repurchasing large quantities of its own shares? Is it ethical for any company to do so? If you were an investor or analyst, what questions would you ask or what cautions would you take in assessing and comparing earnings per share data?(sources: Wayne Duggan. “7 S&P 500 Companies with Stock Buybacks.” US News & World Report.December 14, 2020. https://money.usnews.com/investing/stock-market-news/slideshows/s-p-500-companies-with-stock-buybacks?slide=2; “Apple’s $460 Billion Stock Buyback.” Above Avalon. April 23, 2020. https://www.aboveavalon.com/notes/2020/4/23/apples-460-billion-stock-buyback; “Apple Stock Buybacks (Quarterly).” Ycharts. n.d. https://ycharts.com/companies/AAPL/stock_buyback)
LINK TO LEARNINGStock BuybacksThis Wall Street Journal video about stock buybacks (https://openstax.org/r/video-about-stock-buybacks)
- Bill Maurer. “Apple: New Highs Seem Likely.” Seeking Alpha. May 11, 2020. https://seekingalpha.com/article/4346246-apple-new- highs-seem-likely
explains the various perspectives on the subject. It walks through the basic concepts of how buybacks work and explores some viewpoints on whether buybacks are good, bad, or otherwise.
To put a firm’s earnings per share into perspective and allow for a more meaningful analysis, earnings per share is often tracked over a number of years, such as when presented in the comparative income statements for Clear Lake Sporting Goods (see Figure 6.7).
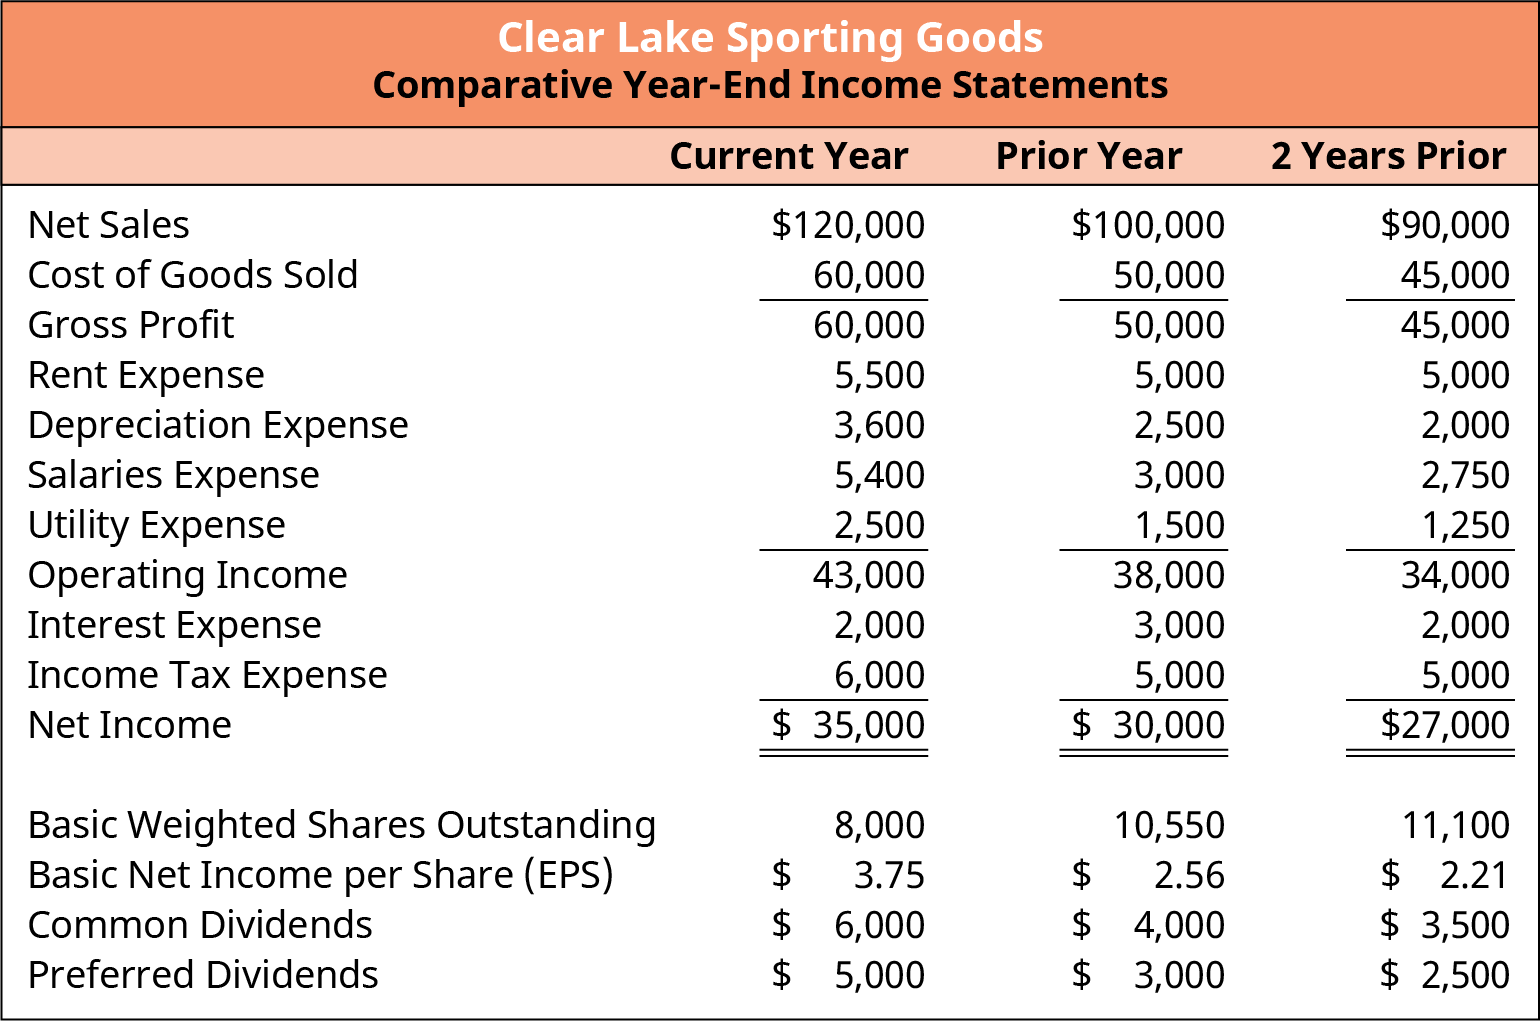
Figure 6.7 Comparative Year-End Income Statements Earnings per share year after year can be a good indication of a company’s financial health.
Most analysts believe that a consistent improvement in earnings per share year after year is an indication of continuous improvement in the earning power of a company. This is what is seen in Clear Lake Sporting Goods’ earnings per share amounts over each of the three years reported, moving from $2.21 to $2.56 to
$3.75. However, it is important to remember that earnings per share is calculated on historical data, which is not always predictive of the future.
THINK IT THROUGHWould You Have Invested?What if, in 1997, you invested $5,000 in Amazon? Today, your investment would be worth nearly $6 million. Potential investors viewing Amazon’s income statement in 1997 would have seen earnings per share of negative $1.27. In other words, Amazon lost $1.27 for each share of common stock outstanding. Would you have invested?Solution:Answers will vary. A strong response would include the idea that a negative or small earnings per share reflects upon the historical operations of a company. Earnings per share does not predict the future.Investors in 1997 looked beyond Amazon’s profitability and saw its business model having strong future potential.
Price/Earnings (P/E) Ratio
The price/earnings (P/E) ratio measures the current market share price of a company’s stock relative to its earnings per share (EPS). The ratio is helpful in comparing performance and stock price of a company to other companies. It’s also helpful in evaluating how much investors are willing to pay for earnings performance.
Investors, in particular, use this ratio and rely on two key characteristics: past performance (trailing) and future estimates (forward). Trailing data can be calculated but is also easily found online, as it’s a common measure reported on financial sites. Investors will often look for P/E TTM, which is the price/earnings ratio for the trailing 12 months (last year worth of earnings data). This helps investors assess one day’s stock price relative to the earnings per share over the past 12 months. P/E ratio is widely used by investors to determine if a stock is over- or undervalued. It also helps them compare one firm to that of the industry average or index, such as the S&P 500.

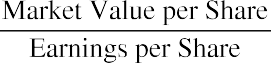
In the prior section we saw earnings per share data for Clear Lake Sporting Goods. Using its current year earnings per share of $3.75 and the current stock price of $69.41, we can calculate price/earnings ratio for Clear Lake Sporting Goods:

An 18.51 ratio means an investor would expect to invest $18.51 to gain $1 of earnings.
Book Value per Share
Book value per share is often used hand in hand with market value per share. Investors compare the two in order to see if the stock is possibly over- or undervalued. Book value is derived from accounting practices and shows the value of the firm on paper. Market value, on the other hand, is determined by supply and demand, based on what investors are willing to pay for the stock. If the market value per share is higher than the book value, the stock is considered overvalued. If the market value is lower than the book value, it’s considered undervalued.
In theory, book value per share represents the total value common shareholders would receive if the firm were liquidated. It is total equity less preferred equity, spread across the total shares outstanding. The formula to calculate book value per share is

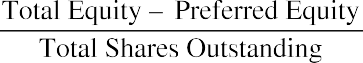
The book value per share for Clear Lake Sporting Goods is

If investors compared the book value per share of $10.00 for Clear Lake Sporting Goods to the P/E ratio of
$18.51, they would likely conclude that the stock was undervalued in the year of analysis.
LINK TO LEARNINGBook Value versus Market Value of SharesThis video about book value and market value (https://openstax.org/r/video-about-book-value) explains the basic concepts and discusses how the two differ. Samples of the concept are then explored using Apple Inc. as an example.
6.6
Profitability Ratios and the DuPont Method
By the end of this section, you will be able to:
- Calculate profit margin to determine how much sales revenues the firm has translated into income.
- Evaluate firm performance by calculating return on total assets and return on equity.
- Analyze organizational performance using DuPont method calculations.
Profitability considers how well a company produces returns given its operational performance. The company needs to use its assets and operations efficiently to increase profit. To assist with profit goal attainment, company revenues need to outweigh expenses. Let’s consider three profitability measurements and ratios: profit margin, return on total assets, and return on equity.
Profit Margin
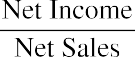
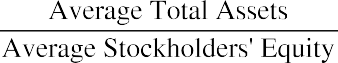
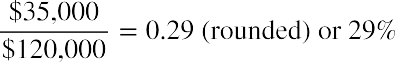
Profit margin represents how much of sales revenue has translated into income. This ratio shows how much of each $1 of sales is returned as profit. The larger the ratio figure (the closer it gets to 1), the more of each sales dollar is returned as profit. The portion of the sales dollar not returned as profit goes toward expenses. The formula for profit margin is

For Clear Lake Sporting Goods, the profit margin in the current year is


This means that for every dollar of sales, $0.29 returns as profit. If Clear Lake Sporting Goods thinks this is too low, the company would try to find ways to reduce expenses and increase sales.
Return on Total Assets
The return on total assets measures the company’s ability to use its assets successfully to generate a profit. The higher the return (ratio outcome), the more profit is created from asset use. Average total assets are found by dividing the sum of beginning and ending total assets balances found on the balance sheet. The beginning total assets balance in the current year is taken from the ending total assets balance in the prior year. The formula for return on total assets is


For Clear Lake Sporting Goods, the return on total assets for the current year is


The higher the figure, the better the company is using its assets to create a profit. Industry standards can dictate what an acceptable return is.
LINK TO LEARNINGReturn on AssetsThis video explains how to calculate return on assets (https://openstax.org/r/video-explains-how-to- calculate) and how to interpret the results. The video provides the formula, a discussion of the concept, and the importance of the ratio.
Return on Equity
Return on equity measures the company’s ability to use its invested capital to generate income. The invested capital comes from stockholders’ investments in the company’s stock and its retained earnings and is leveraged to create profit. The higher the return, the better the company is doing at using its investments to yield a profit. The formula for return on equity is

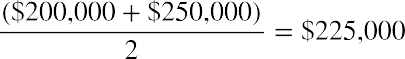
Average stockholders’ equity is found by dividing the sum of beginning and ending stockholders’ equity balances found on the balance sheet. The beginning stockholders’ equity balance in the current year is taken from the ending stockholders’ equity balance in the prior year. Keep in mind that the net income is calculated after preferred dividends have been paid.
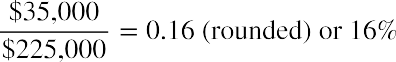
For Clear Lake Sporting Goods, we will use the net income figure and deduct the preferred dividends that have been paid. The return on equity for the current year is


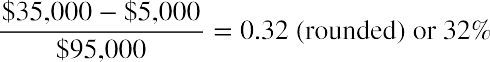
The higher the figure, the better the company is using its investments to create a profit. Industry standards can dictate what an acceptable return is.
The DuPont Method
ROE in its basic form is useful; however, there are really three components of ROE: operating efficiency (profit margin), asset usage (total asset turnover), and leverage (equity ratio). This is known as the DuPont method. It originated in 1919 when the DuPont company implemented it for internal measurement purposes.2 The DuPont method can be expressed using this formula:


Profit margin indicates how much profit is generated by each dollar of sales and is computed as shown:

Total asset turnover indicates the number of sales dollars produced by every dollar invested in capital assets—in other words, how efficiently the company is using its capital assets to generate sales. It is computed as shown:
- Joshua Kennon. “What Is the DuPont Method Return on Equity, or ROE, Formula?” The Balance. December 16, 2020. https://thebalance.com/the-dupont-model-return-on-equity-formula-for-beginners-357494
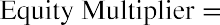
The equity multiplier measures leverage. It is computed as shown:


Using DuPont analysis, investors can see overall performance broken down into smaller pieces, which helps them better understand what is driving ROE. We already have the computations for Clear Lake Sporting Goods’ profit margin and total asset turnover:


We can calculate the equity multiplier using the equity multiplier equation and prior calculations for Clear Lake’s average total assets and average stockholder equity:


Now that we have all three elements, we can complete the DuPont analysis for Clear Lake Sporting Goods:


LINK TO LEARNINGThe DuPont MethodThis video about the DuPont method (https://openstax.org/r/video-about-DuPont-method) walks through its history, discusses its basic components, and shows how to calculate and interpret each measurement.
Performance Analysis
ROE captures the nuances of all three elements. A good sales margin and a proper asset turnover are both needed for a successful operation. Like all ratios, assessing performance is relative. It’s important to look at the ratio in context of the organization, its history, and the industry. If we compare Clear Lake’s ROE of 26.4% to the recreational products industry average of 12.56% for the same year, it would appear as though Clear Lake Sporting Goods is outperforming the general industry. However, recreational products can include a wide variety of businesses beyond just the outdoor gear in which Clear Lake Sporting Goods specializes. An analyst could look at other key competitors such as Cabela’s or Bass Pro Shops to get even more relevant comparisons.
Clear Lake Sporting Goods is also technically a retail store, albeit a specialized one. An analyst might also consider the industry averages for general or online retail of 20.64% and 27.05%, respectively. Compared to the broader retail industry, Clear Lake Sporting Goods is still performing well, but its performance is not as
disparate to industry average as when compared to recreational products (see Table 6.1).
|
ROE (%) |
|
|
|
2.93 |
|
Air Transportation |
−47.03 |
|
Computer Services |
13.50 |
|
Banking |
8.22 |
|
Financial Services (nonbanking) |
64.28 |
|
Food Processing |
10.12 |
|
Renewable Energy |
−20.59 |
|
Hospitals/Health Care Facilities |
70.64 |
|
Hotels/Gaming |
−30.40 |
|
Publishers |
−14.18 |
|
Recreational Products |
12.56 |
|
Real Estate (general) |
2.00 |
|
Retail: |
0.00 |
|
Automotive |
36.28 |
|
Building Supply |
0.27 |
|
General |
20.64 |
|
Grocery |
30.63 |
|
Online |
27.05 |
|
Rubber and Tires |
−26.69 |
|
Shoes |
23.70 |
|
Software (systems and applications) |
28.09 |
|
Transportation |
21.47 |
|
Total Market Average |
8.25 |
Table 6.1 Return on Equity by Industry in 2020 It’s important to look at any ratio in context of the organization, its history, and the industry. (data source: Aswath Damodaran Online)
 Summary
Ratios: Condensing Information into Smaller Pieces
Ratios used in financial analysis can help investors and other analysts identify trends over time, compare companies to one another, and make informed decisions about a company. There are, however, limitations to analysis, so it should be used wisely and in conjunction with other contextual information available.
Operating Efficiency Ratios
Efficiency ratios measure how well management uses the assets of the organization to earn a profit. Common efficiency ratios include accounts receivable turnover, total asset turnover, inventory turnover, and days’ sales in inventory.
Liquidity Ratios
Liquidity ratios help analysts measure how well an organization can meet its short-term obligations (liabilities) as they come due. Common ratios to measure liquidity include the current ratio, the quick ratio, and the cash ratio. Each of these three ratios includes more (cash ratio) or less liquid (current ratio) current assets in its measure of liquidity.
Solvency Ratios
Solvency ratios measure how well an organization can meet its long-term obligations (liabilities) as they come due, or in more general terms, its ability to stay in business. Common solvency ratios include the debt-to- assets ratio and the debt-to-equity ratio.
Market Value Ratios
Market value ratios help analysts assess the value of publicly traded firms in the market. The most commonly used market value ratios include earnings per share (EPS), the price/earnings ratio, and book value per share.
Profitability Ratios and the DuPont Method
Profitability ratios help measure how effectively the organization earns a profit. Common profitability ratios include profit margin, return on total assets, and return on equity. The DuPont method breaks down return on equity into three smaller components for a more thorough assessment of performance: profit margin, total asset turnover, and an equity multiplier.
 Key Terms
accounts receivable turnover ratio measures how many times in a period (usually a year) a company will collect cash from accounts receivable
book value per share total book value (assets – liabilities) of a firm expressed on a per-share basis
cash ratio represents the firm’s cash and cash equivalents divided by current liabilities; often used by investors and lender to asses an organization’s liquidity
current ratio current assets divided by current liabilities; used to determine a company’s liquidity (ability to meet short-term obligations)
days’ sales in inventory the number of days it takes a company to turn inventory into sales
debt-to-assets ratio measures the portion of debt used by a company relative to the amount of assets
debt-to-equity ratio measures the portion of debt used by a company relative to the amount of stockholders’ equity
DuPont method framework for financial analysis that breaks return on equity down into smaller elements
earnings per share (EPS) measures the portion of a corporation’s profit allocated to each outstanding share of common stock
efficiency ratios ratios that show how well a company uses and manages its assets
inventory turnover measures the number of times an average quantity of inventory was bought and sold during the period
liquidity ability to convert assets into cash in order to meet primarily short-term cash needs or emergencies
market value ratios measures used to assess a firm’s overall market price
operating cycle amount of time it takes a company to use its cash to provide a product or service and collect payment from the customer
price/earnings (P/E) ratio company’s stock price divided by the company’s earnings per share; indicates the amount investors are willing to pay for one dollar of earnings
profit margin represents how much of sales revenue has translated into income
quick ratio also known as the acid test ratio; ratio used to determine a firm’s ability to pay short-term debts using its most liquid assets
return on equity measures the company’s ability to use its invested capital to generate income
return on total assets measures the company’s ability to use its assets successfully to generate a profit
solvency implies that a company can meet its long-term obligations and will likely stay in business in the future
times interest earned (TIE) ratio measures the company’s ability to pay interest expense on long-term debt incurred
total asset turnover measures the ability of a company to use its assets to generate revenues