3 Lesson 2 Financial Statements
People say that accounting is the “language of business.” Using the language of business, accountants are able to communicate the financial performance and health of a firm via four key financial statements. These statements are the income statement, balance sheet, statement of owner’s equity, and statement of cash flows. Each statement provides different insights into a firm’s performance and financial health. Though some users may favor one or two statements over another, they are best used together to get a full picture.
In this chapter, you’ll be introduced to a firm called Clear Lake Sporting Goods. Clear Lake Sporting Goods is a small merchandising company (a company that buys finished goods and sells them to consumers) that sells hunting and fishing gear. It needs financial statements to understand its profitability and current financial position, manage cash flow, and communicate its finances to outside parties like investors, governing bodies, and lenders. We will walk through each financial statement, its components, how they are connected, and how financial statement users understand each one.
 5.1
5.1
The Income Statement
Learning Outcomes
By the end of this section, you will be able to:
- Outline the purpose and importance of the income statement.
- Identify the structure and key elements of the income statement.
- Discuss the use of EBITDA as a measure of a company’s profit.
Financial information flows from one financial statement to the next. Thus, the statements are prepared in a specific order. The first statement prepared is the income statement.
Functionality of the Income Statement
The income statement shows a firm’s performance over a specific period of time. The statement helps financial statement users understand the sales generated during the period and the expenses incurred to generate those sales. If the expenses are smaller than the sales, the net result is profitability, or net income, rather than a net loss.
Breaking the income statement down into smaller pieces provides a more transparent view of the firm’s performance, allowing users to see more clearly what areas of the business incurred expenses. This is helpful to management in driving improvements and to outside users in assessing performance.
Sales and Gross Profit
The first section of the income statement begins with sales. Though financial statements are required to follow a certain format, account names can differ slightly from one firm to another. You may see the first line, often referred to as the top line, called sales, sales revenue, revenue, service revenues, and other similar titles. All of these titles are meant to reflect the sales generated by selling product to customers in the day-to-day business. On Clear Lake’s income statement in Figure 5.2, we see its top line referred to as Sales.
Income from items that aren’t common to the firm’s day-to-day business are reported as gains and losses, and they are reported further down in the income statement rather than at the top line with its regular, core business activities. This is to ensure that anomalies like selling a machine or a loss on retiring a bond don’t mislead financial statement users as to the general performance of the firm and impact their assumptions of future results.
Firms report their sales and any reductions to sales separately on the income statement. They begin with gross sales, which includes all sales to customers. Clear Lake reported gross sales of $105,000 last year and
$126,000 this year. The next line is sales returns and allowances, which is deducted from gross sales in order to find net sales. Clear Lake’s sales returns and allowances were $5,000 and $6,000 respectively, leaving the company with net sales of $100,000 and $120,000 respectively

Next, the cost of goods sold (COGS) is deducted from net sales in order to arrive at gross profit. (It is customary to refer to sales minus COGS as gross profit because gross margingross profit/sales.) Cost of goods sold includes the costs directly involved in making the product that was sold during the period.
Common examples of costs included in cost of goods sold include direct labor, direct materials, and the overhead assigned to the product in production. For a service business, this would include its direct labor and any materials used to deliver its services. For a retail firm like Clear Lake Sporting Goods, this would include the costs of all the goods it purchased for resale. Clear Lake’s COGS is seen at $50,000 and $60,000 for the prior and current years. Note that different types of companies will have different types of costs deducted in their Cost of Goods section. Clear Lake Sporting Goods is a retailer, or merchandiser that buys good to resell. Their cost of goods includes the cost of goods they purchased to resell. In the link to learning, you will explore Apple, a technology manufacturer. Their cost of goods would include the cost to manufacture the goods they
sell. Another type of firm is a service firm. A law office, for example, would include primarily the cost of labor in their cost of services.
Gross profit is a reflection of how profitable the firm’s performance was in its core business function. It includes only the core business and direct costs of performing that business. If the company were a shoe company, gross profit would show how profitable the company was in simply making the shoes it sold. If it were a bakery, gross profit would show how profitable the company was in simply baking the goods it sold. Gross profit shows financial statement users how effective the business is at generating top-line profits on their core business function. It does not reflect the performance of other areas of the firm such as other operating costs to support the direct production process, indirect costs, and financing.


For Clear Lake Sporting Goods, we see its gross profit in Figure 5.2. The company earned $50,000 of gross profit the prior year and $60,000 in the current year
 .
.
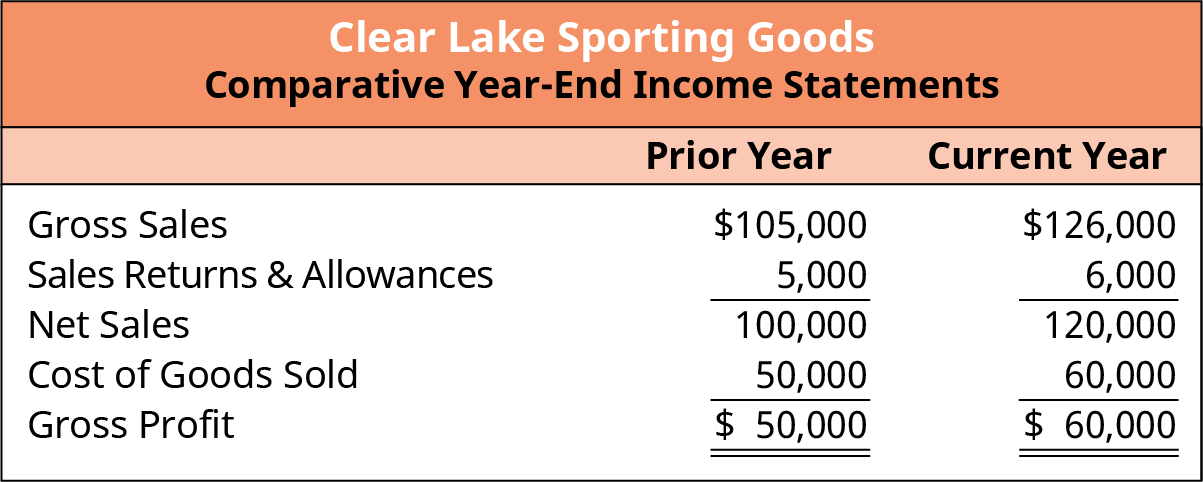
Figure 5.2 Income Statement through Gross Profit Line
LINK TO LEARNINGGross ProfitVisit the Apple, Inc. Annual Report (https://openstax.org/r/2020-doc-financial-annual-report) for 2020 and locate the income statement (it begins on page 31). Review gross sales, sales returns and allowances, and net sales for the last few years. What can you learn about the company’s recent performance in the area of sales? Is the gross sales line improving? How about the sales returns and allowances line? Has it improved or declined or simply changed incrementally with gross sales?Review the firm’s gross profit for the past few years. Has it improved or declined? Consider the company’s improvement (or decline) in gross sales as compared to the improvement or decline in gross profit. Does it reflect any change in performance over time (earning more or less gross profit on its gross sales)?
Income from Operations
Gross profit is a very helpful measure, but it is only the first of several provided by the income statement. After gross profit is calculated, other operating expenses are deducted in order to calculate the firm’s income from operations, also commonly called operating income. Common operating costs found in this section include building rent and utilities, property taxes, wages and salaries, and other overhead costs. In Figure 5.3, we can see Clear Lake’s operating expenses. To sell its hunting and fishing equipment in the current year, Clear Lake Sporting Goods paid rent for its building ($5,500) and utilities for its retail and warehouse spaces ($2,500); recorded depreciation on equipment, buildings, and store furnishings (shelves, racks, etc.) ($3,600); and paid salaries to its indirect employees in accounting, purchasing, and human resources ($5,400). The company’s operating expenses are deducted from gross profit to arrive at operating income

While gross profit reflects only how profitable the firm was in making its core product, operating income
reflects how profitable the firm’s daily operations were as a whole. This still does not include other miscellaneous items outside the scope of a firm’s normal business. Just as the name implies, it shows income from the core operations of the firm.
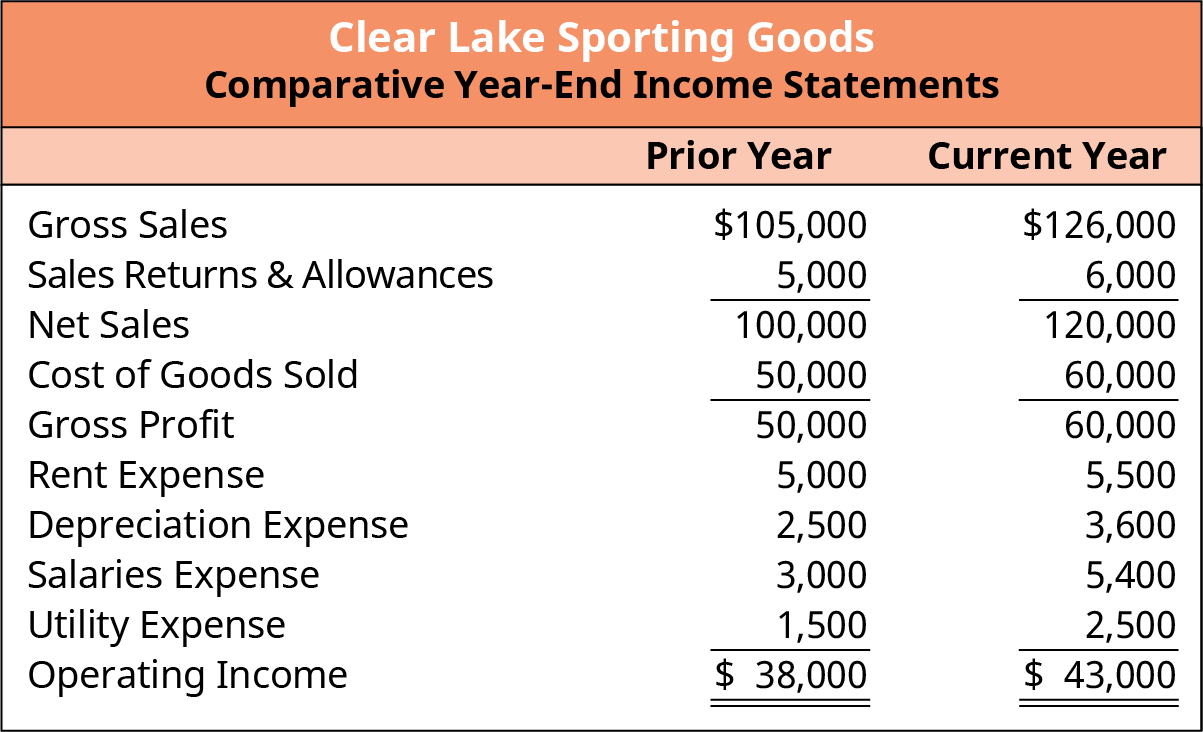
Figure 5.3 Income Statement through Income from Operations
 We can see that the company was able to generatemore in net sales in the current year than the prior year. However, it only generatedin gross profit and

of additional operating income. Further investigation shows that while net sales increased, so did the direct costs of its goods (COGS) and its operating expenses.
We will further explore how to assess each of these expenses later in the chapter using common-size analysis. Common-size analysis reflects each element of a financial statement as a percentage of the base. In the case of the income statement, the base is net sales. Here we would see that COGS was 50 percent of net sales in both the current  and prior year
  , indicating there wasn’t any significant change in performance we could detect from the information provided in the income statement.
LINK TO LEARNINGOperating ExpensesVisit the Apple, Inc. Annual Report (https://openstax.org/r/2020-doc-financial-annual-report) for 2020 and locate the company’s income statement (the income statement begins on page 31). Review Apple’s operating income for the last few years. Has it improved or declined? Does this fall in line with your expectations based on your previous review of the company’s net sales and gross profit?Based on the improvement or decline in operating income, review Apple’s operating expenses to investigate. Have any of the operating expenses changed significantly? How did that impact the company’s operating income? What might it tell you about the company’s performance?
Net Income
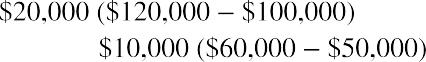
Finally, we move on to net income, or what is commonly referred to as the bottom line. Net income (or loss) reflects the net impact of all financial transactions for the firm, including those that are caused by events outside the normal course of business. The most common items deducted from operating income to arrive at net income include interest expense, gains/losses, and income tax expense. Remember, gains and losses are those that result from unusual transactions outside the normal course of business. Examples include selling a piece of old equipment or a loss on retiring debt.
We can see in Figure 5.4 that Clear Lake Sporting Goods has outstanding debt, so it incurred interest expense
of $2,000 in the current year and $3,000 the prior year. Since it recorded net income (not a loss), it must also record income tax expense of $6,000 in the current and $5,000 in the prior year.
Figure 5.4 Comparative Year-End Income Statement
EBITDA (Earnings before Interest, Taxes, Depreciation, and Amortization)
Now that we have a full income statement, we can look at another commonly used measure of financial performance called EBITDA. EBITDA stands for earnings before interest, taxes, depreciation, and amortization. Amortization is similar to depreciation. It is the spreading of the cost of an intangible asset over the course of its useful life. Intangible assets are long-term assets that lack physical substance, such as patents and copyrights.
Since EBITDA removes noncash items from the net income equation, it is considered a useful measure in assessing the cash flows provided by operating activities. We will assess cash flows using the statement of cash flows and various other cash flow measures later in this chapter as well.
As shown in Figure 5.5, Clear Lake Sporting Goods’ EBITDA in the prior year was

and in the current year was

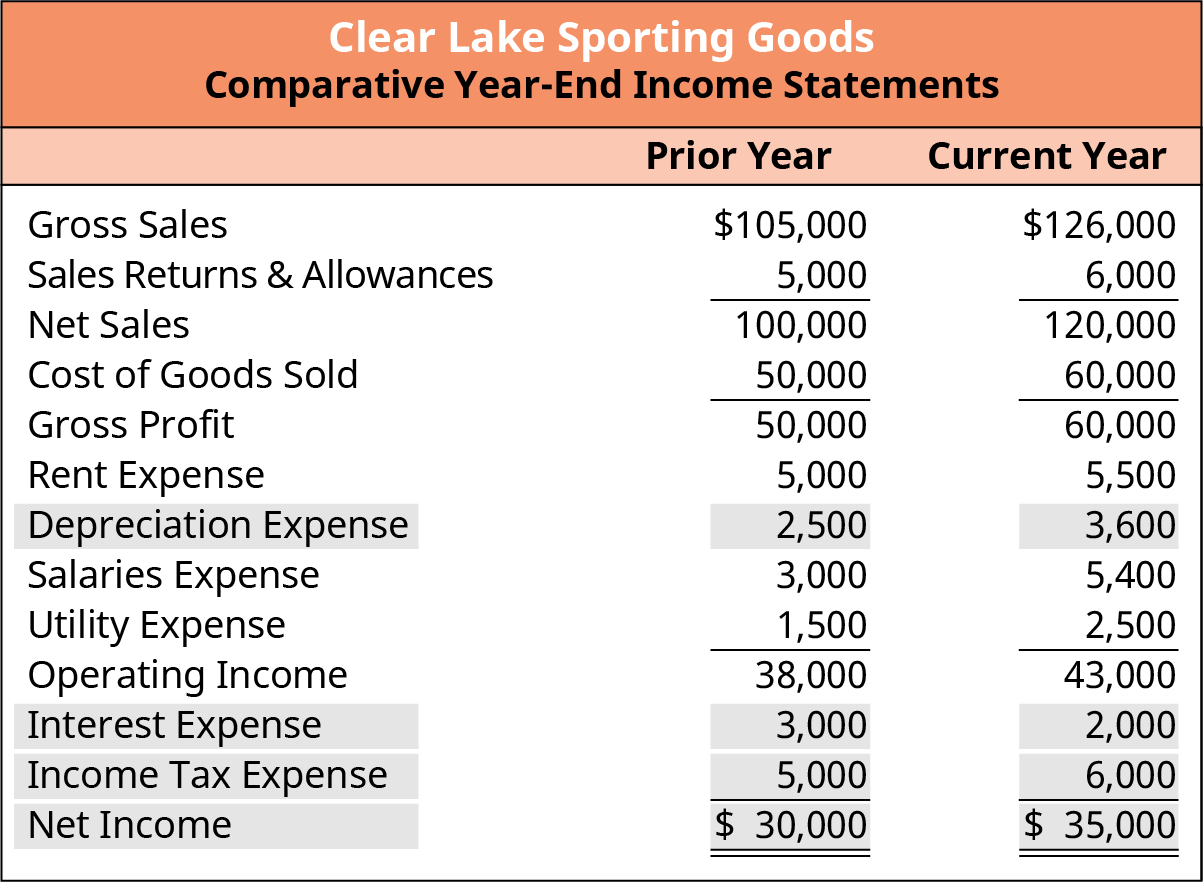
Figure 5.5 EBITDA (Earnings before Interest, Taxes, Depreciation, and Amortization)
THINK IT THROUGHNet IncomeVisit the Apple, Inc. Annual Report (https://openstax.org/r/2020-doc-financial-annual-report) for 2020 and locate the company’s income statement (the income statement begins on page 31). Review net income for the last few years. Has it improved or declined? Does this fall in line with your expectations based on your previous review of the company’s operating income?Solution:Net income improved in the current year over last year but declined from 2018 to 2019 (from $59,531 to$55,256). Apple’s EBITDA in 2020 was 108.89. (Amounts are in millions.)
5.2
The Balance Sheet
Learning Outcomes
By the end of this section, you will be able to:
- Outline the purpose and importance of the balance sheet.
- Identify the structure and key elements of the balance sheet.
The Accounting Equation and the Classified Balance Sheet
Recall that the income statement shows the performance of a firm over the course of time. The classified balance sheet shows the financial state of a company as of a specific point in time. It is a key distinction between the two statements. The classified balance sheet is prepared in sections that align with the accounting equation.
Remember, the accounting equation reflects the assets (items owned by the organization) and how they were obtained (by incurring liabilities or provided by owners). Liabilities are debts owed to other parties. Stated differently, every asset has a claim against it—by creditors and/or owners.

The classified balance sheet is thus broken down into three sections; assets, liabilities, and owner’s equity. If
prepared correctly, the total assets on the balance sheet equals the total liabilities and owner’s equity sections of the balance sheet.
The classified balance sheet is considered or termed classified when the assets and liabilities within the balance sheet are grouped into even smaller sections: current and noncurrent (see Figure 5.6). Both assets and liabilities are broken down on the balance sheet into current and noncurrent classifications in order to provide more detail and transparency as well as abide by the convention of reporting in descending order of liquidity. Current assets are those that can be used or converted to cash within a year. Common examples of current assets include cash, inventory, accounts receivable, and short-term investments. Assets that will be in use longer than a year are considered noncurrent. Common examples of noncurrent assets include notes receivable, machinery and equipment, buildings, and land.
Just as we noted a few key differences in the income statements based on the type of firm, you may also notice a few slight differences in the balance sheet depending on the firm type. Clear Lake Sporting Goods is a retailer. Thus, you will see that their inventory for resale on their balance sheet is simply called “Inventory.” This is the goods they have purchased for resale but have not yet sold. A manufacturer, like Apple, Inc. in the Link to Learning sections, will have a variety of inventory types including raw materials, work in progress, and finished goods inventory. These represent the various states of the inventory (ready to use, partially complete, and fully completed product). A service firm, on the other hand, may not have inventory at all. If it does, it may be simple goods it uses to help deliver its service. For example, a cleaning company may keep an inventory of cleaning supplies.

Figure 5.6 Graphical Representation of the Accounting Equation Both assets and liabilities are categorized as current and noncurrent.
Clear Lake Sporting Goods has cash, accounts receivable, inventory, short-term investments, and equipment. It rents its facilities, so it has no buildings on its balance sheets. Of all its assets, only the equipment is long term. The assets section for Clear Lake’s classified balance sheet is shown in Figure 5.7.
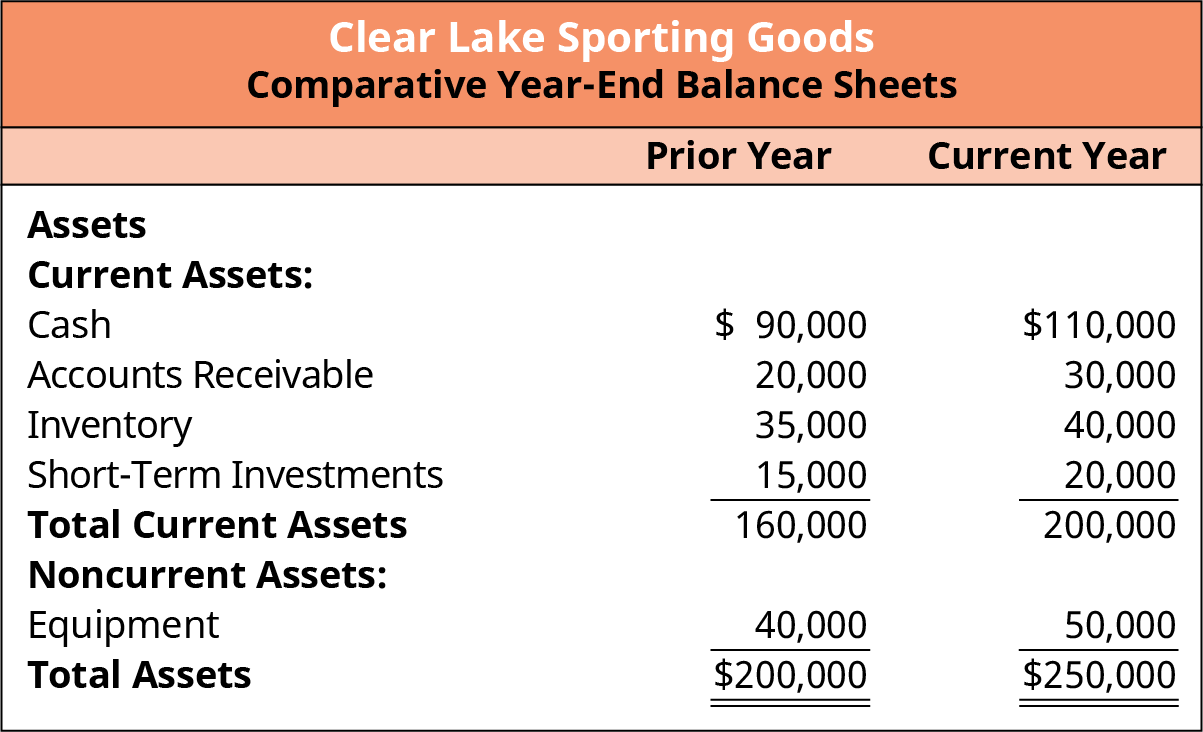
Figure 5.7 Assets Section of Classified Balance Sheet
THINK IT THROUGHCurrent and Noncurrent AssetsVisit the Apple, Inc. Annual Report (https://openstax.org/r/2020-doc-financial-annual-report) for 2020 and locate the company’s balance sheet (the balance sheet begins on page 33). What types of current assets
does the company have? What types of noncurrent assets does it have? How has the total of each type of asset changed over time?Solution:Apple reports cash and cash equivalents, marketable securities, accounts receivable, inventories, vendor non-trade receivables, and “other” current assets on its balance sheet. The company’s current assets decreased from $162,819 in 2019 to $143,713 in 2020. Apple reports marketable securities, property, plant and equipment, and other noncurrent assets in the noncurrent asset section of its balance sheet. The company’s noncurrent assets increased from $175,697 in 2019 to $180,175 in 2020. (Amounts are in millions.)
We’ve covered the assets side of the accounting equation; now let’s turn our attention to the other side of the equation and the other two sections of the balance sheet: liabilities and equity. Just like the assets section, the liabilities section is broken down between current and noncurrent. Current liabilities are those that will be due within a year. Common examples of current liabilities include accounts payable, wages payable, and unearned revenue. Noncurrent liabilities are those that are due more than a year into the future. Notes payable is a common noncurrent liability.
Clear Lake Sporting Goods has accounts payable and has collected payments from a few customers that it hasn’t yet shipped its product to (unearned revenue). It also owes money on a note payable. Its accounts payable and unearned revenue are both current liabilities. The note payable is not due for several years, thus making it a noncurrent liability (see Figure 5.8).
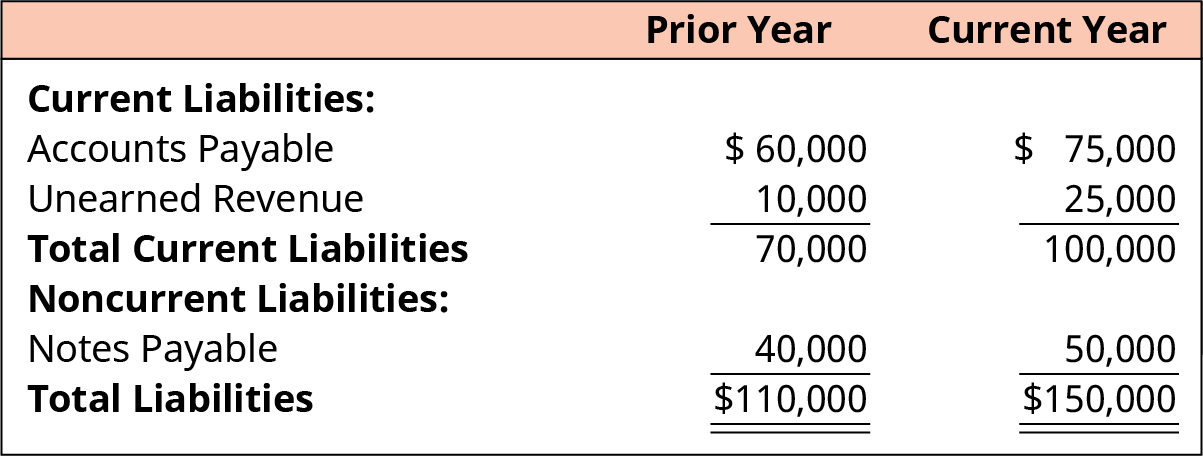
Figure 5.8 Liability Section of Classified Balance Sheet
THINK IT THROUGHCurrent and Noncurrent LiabilitiesVisit the Apple, Inc. Annual Report (https://openstax.org/r/2020-doc-financial-annual-report) for 2020 and locate its balance sheet (the balance sheet begins on page 33). What types of current and noncurrent liabilities does the company have? How has the total of each type of liability changed over time?Solution:Apple has accounts payable, deferred revenue, commercial paper, and term debt listed as current liabilities. Its current liabilities declined by only a small amount from 2019 to 2020 ($105,718 to $105,392).The company has term debt and “other” listed as noncurrent liabilities, which increased from 2019 to 2020 ($142,310 to $153,157). (Amounts are in millions.)
The stockholders’ equity section of the balance sheet for corporations contains two primary categories of accounts. The first is contributed capital, which is funds paid in by owners. The second category is earned
capital, which is funds earned by the corporation as part of business operations. On the balance sheet, retained earnings is a key component of the earned capital section, while the stock accounts such as common stock, preferred stock, and additional paid-in capital are the primary components of the contributed capital section.
Clear Lake Sporting Goods has just one contributed capital account—common stock—and one earned capital account—retained earnings. The equity section of its balance sheet is shown in Figure 5.9.
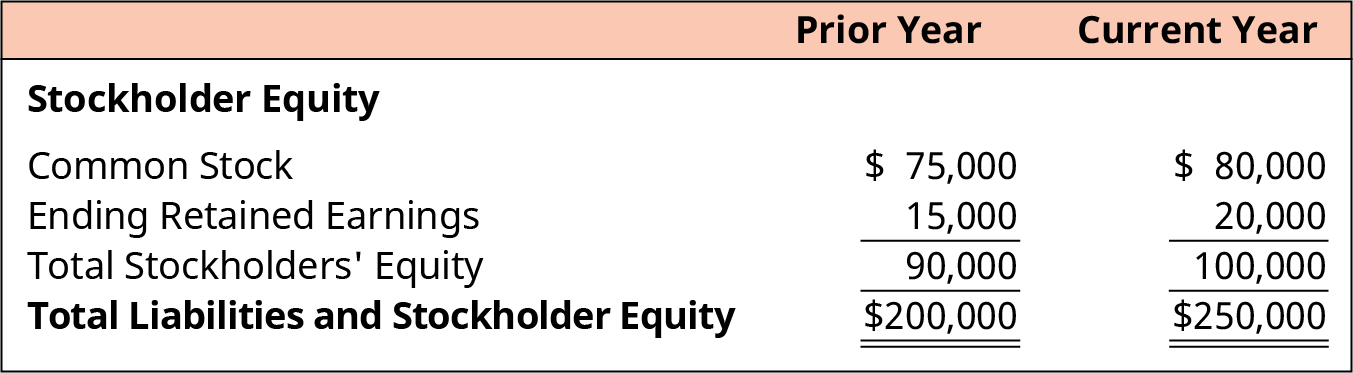
Figure 5.9 Stockholders’ Equity Section of Classified Balance Sheet
THINK IT THROUGHAssets, Liability, and EquityVisit the Apple, Inc. Annual Report (https://openstax.org/r/2020-doc-financial-annual-report) for 2020 and locate the company’s balance sheet (the balance sheet begins on page 33). What is the amount of the company’s total assets for the most recent year? What is the amount of its total liabilities and equity?Solution:Apple’s total assets for 2020 were $323,888, and its total liabilities and equity were also $323,888. (Amounts are in millions.)
Importance of the Balance Sheet
Now that we have gone to all the work to carefully assemble a classified balance sheet, what do we use it for? The answer lies within the accounting equation itself. Think of the accounting equation from a “sources and claims” perspective. Under this approach, the assets (items owned by the organization) were obtained by incurring liabilities or were provided by owners. Stated differently, every asset has a claim against it—by creditors and/or owners. The balance sheet shows us what the firm has (its assets), who owns them (equity), and who the firm owes (its liabilities).
Limitations of the Balance Sheet
The balance sheet is indeed a very helpful financial statement, but it also poses challenges. First, assets on the balance sheet, under generally accepted accounting principles (GAAP), are recorded at historical cost.
Historical cost is simply the cost paid for the item at the time it was purchased. Changes in market value of big- ticket items like land or buildings are not reflected in the balance sheet. Land remains at historical cost, and depreciable items like buildings are reflected at their current book value (historical cost less accumulated depreciation). If the asset has appreciated over time, the higher market value of the assets would not be seen on the balance sheet.
Estimates are another limitation of the balance sheet. Items on the balance sheet such as allowance for doubtful accounts and allowance for bad debt are based on estimates. The useful lives for calculating depreciation is another common estimate. If these estimates are incorrect, the net value of the asset can be under- or overstated.
Another key limitation is the fact that a balance sheet reflects balances at only one given point in time. This
means that the account value could have been quite different on the day before or the day after the date of the balance sheet. For example, if a firm were concerned with certain ratios or investor/lender expectations of its cash balance, it could choose to not pay several vendor payments in the last week of December. Thus, on December 31, the firm reflects a high cash balance on its balance sheet. However, by the end of the first week of January, it has caught up on late vendor payments and again shows a low cash balance.
Finally, there are many possible things of value that are not recorded on the balance sheet. Internally generated assets and the firm’s human capital are two common examples. Internally generated assets can be anything from a website, a process, to an idea.
5.3
The Relationship between the Balance Sheet and the Income Statement
Learning Outcomes
By the end of this section, you will be able to:
- Identify connected elements between the balance sheet and the income statement.
- Differentiate between expenses and payables.
Net Income and Retained Earnings
As mentioned earlier, the financial statements are linked by certain elements and thus must be prepared in a certain order. The income statement was first since net income (or loss) is a required figure in preparing the balance sheet. During the period close process, all temporary accounts are closed to the income summary account, which is then closed to retained earnings. All revenue and expense accounts are closed since they are temporary. The net result is either net profit or net loss as the balance in the income summary account.
Remember that the retained earnings account reflects all income the firm has earned since its inception less any dividends paid out to shareholders. Thus the result (net income) of the income statement feeds the retained earnings account on the balance sheet. Retained earnings is also an element of the statement of stockholders’ equity, which we will cover later in this chapter.
In Figure 5.10, we see net income in the current year of $35,000, which was added to the company’s prior year retained earnings balance of $15,000. Notice, however, that the prior year balance was $15,000, and the current year balance is only $20,000. It does not total $50,000 as we might have expected.
Remember, retained earnings represents all earnings since inception less any dividends paid out. Clear Lake Sporting Goods must have paid out $30,000 in dividends in the current year. We will see this information laid out in the statement of retained earnings. In the prior year they began with a $10,000 balance in retained earnings. Income of $30,000 increased retained earnings and dividends paid back out to investors reduced retained earnings, leaving an ending balance in the prior year of $15,000. This rolls over and is the beginning balance for the current year. In the current year Clear Lake had net income of $35,000 and paid $30,000 of their earnings out to shareholders, essentially resulting in a $5,000 increase to the retained earnings account.
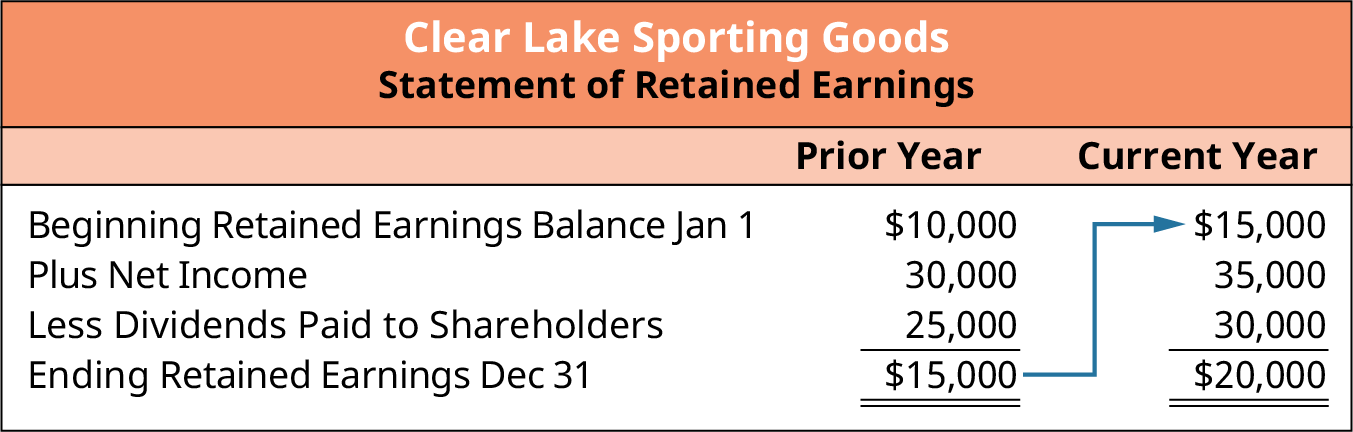
Figure 5.10 Statement of Retained Earnings
Now we can see the full flow of information from the income statement to the statement of retained earnings (Figure 5.10) and finally to the balance sheet. Clear Lake’s net income flows from the income statement into
retained earnings, which is reflected on the statement of retained earnings. The balance in retained earnings is then reflected on the balance sheet. This flow is depicted in Figure 5.11.
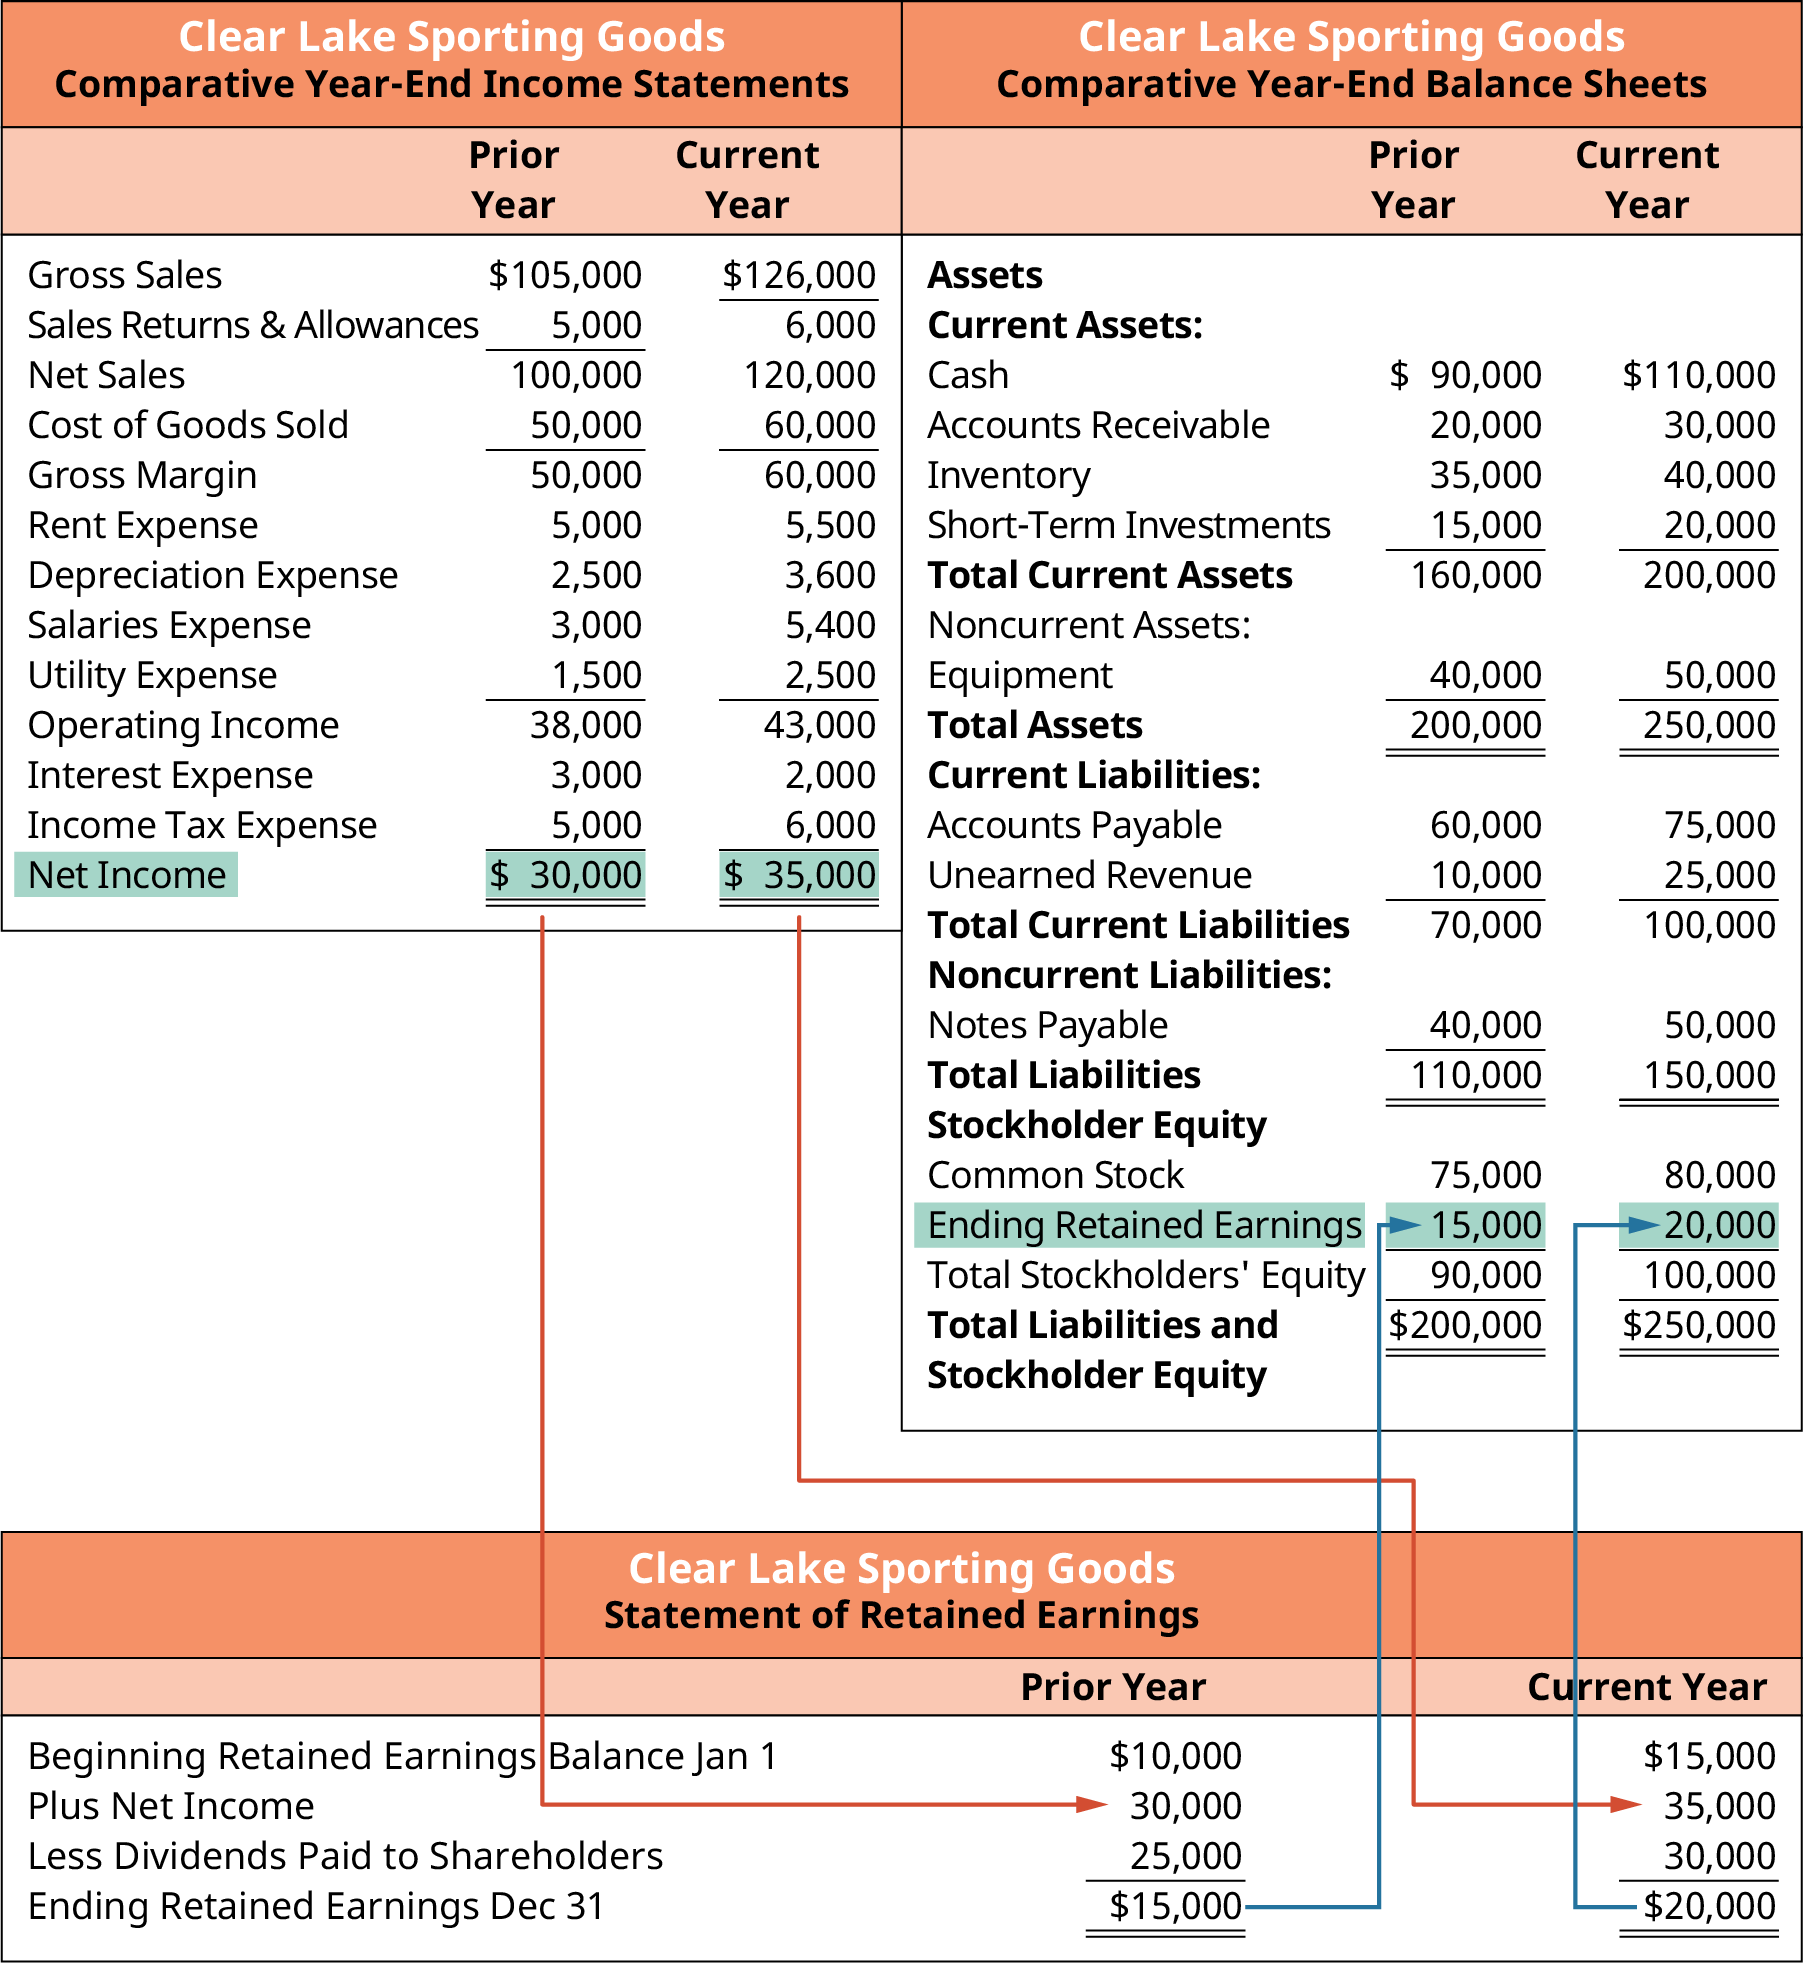
Figure 5.11 Connections between Clear Lake Sporting Goods’ Balance Sheet and Income Statement
LINK TO LEARNINGApple’s Income Statement and Balance SheetVisit the Apple, Inc. Annual Report (https://openstax.org/r/2020-doc-financial-annual-report) for 2020 and locate the company’s income statement and balance sheet (they begin on page 31). What is the company’s net income for the most recent year? What is the amount of retained earnings on the balance sheet for the current and prior years? Does it appear the company paid out dividends this year?
Expenses versus Payables
There is another key relationship between the income statement and the balance sheet can often be confusing to non-accountants: an expense versus a payable. The two are often assumed to be the same thing. However, it is important to note that the two are distinctly different.
Let’s look at an example to outline the key differences. Clear Lake Sporting Goods incurred utility expenses during the current period (electric and gas). Its utilities totaled $1,500. In the month that followed, the utilities vendor sent an invoice for $1,500. Clear Lake has incurred an expense. It will reflect an expense of $1,500 on the income statement for the utilities expense. This is the income statement impact of the transaction. So is it safe to assume that because Clear Lake has an expense, it also used cash? Not necessarily. Or is it safe to assume that if the company has an expense, it is the same as a payable? Again, the answer is no.
Remember, the accounting equation rests on the foundation of the double-entry accounting system. This means that every transaction has two sides: a debit and a credit. They must be equal. When Clear Lake records an expense of $1,500, it must also record the other half of that transaction. In this case, the company incurred utilities expenses throughout the period “on account,” which means it records an increase in their accounts payable. When the invoice comes due, another transaction must then be recorded to reduce accounts payable and reduce cash. Accounts payable is a liability found on the balance sheet, normally a current liability. The expense incurred caused the payable, but it is distinctly separate from the payable (see Figure 5.12).
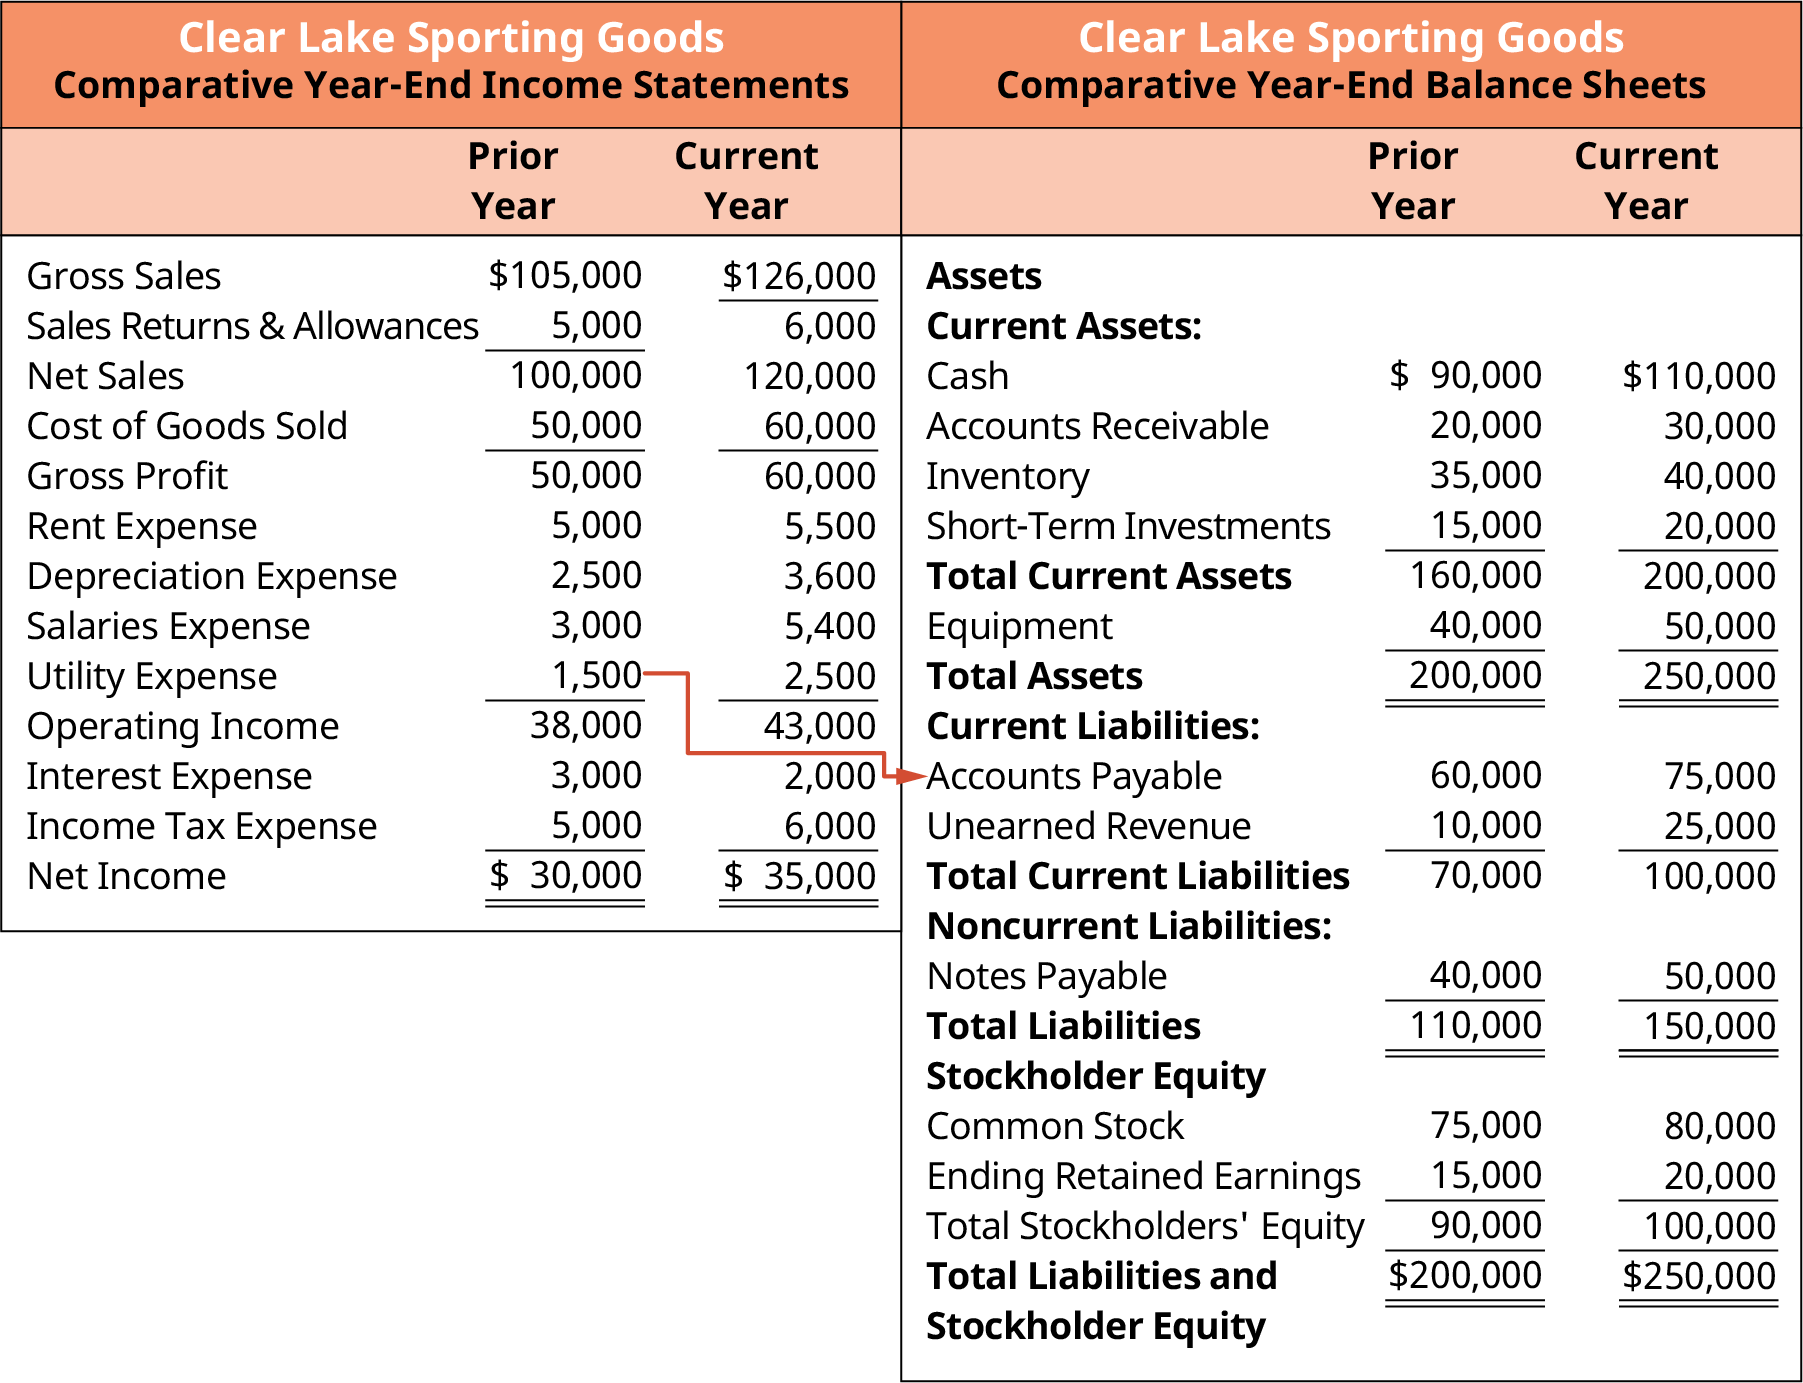
Figure 5.12 Connections between Expenses and Accounts Payable
5.4
The Statement of Owner’s Equity
Learning Outcomes
By the end of this section, you will be able to:
- Explain the concept of owner’s equity.
- Outline the purpose and importance of the statement of owner’s equity.
- Identify the structure and key elements of the statement of owner’s equity.
What Is Equity?
Recall that the accounting equation can help us see what is owned (assets), who is owed (liabilities), and finally who the owners are (equity). The statement of owner’s equity addresses the last segment of the accounting equation in detail by laying out the equity elements of the firm and highlighting changes in these elements throughout the period.
Equity represents the ownership of the firm. The stockholders’ equity section of the balance sheet for corporations contains two primary categories of accounts. The first is paid-in capital or contributed capital—consisting of amounts paid in by owners. The second category is earned capital, consisting of amounts earned by the corporation as part of business operations. On the balance sheet, retained earnings is a key component of the earned capital section, while the stock accounts such as common stock, preferred stock, and additional paid-in capital are the primary components of the contributed capital section.
Common stock represents ownership in the firm. Common stockholders normally have voting rights. Preferred stock has unique rights that are “preferred,” or more advantageous, to shareholders than common stock. Unlike common stockholders, preferred shareholders typically do not have voting rights and do not share in the common stock dividend distributions. Instead, the “preferred” classification entitles shareholders to a dividend that is fixed (assuming sufficient dividends are declared). Treasury stock is shares that were outstanding and have been repurchased by the firm but not retired. Thus they are still issued, but not outstanding. Additional paid-in capital is the difference between the issue price and par value of the common stock. For example, if a firm issued and sold stock at a market price of $20 that had a $5 par value, $5 for each share would be recorded into common stock and the excess $15 per share would be recorded into the additional paid-in capital account.
If we review the balance sheet for Clear Lake Sporting Goods, we see just two elements of equity: common stock and retained earnings. Common stock in the prior year was $75,000 and increased to $80,000 in the current year, indicating Clear Lake issued additional common stock (see Figure 5.13).
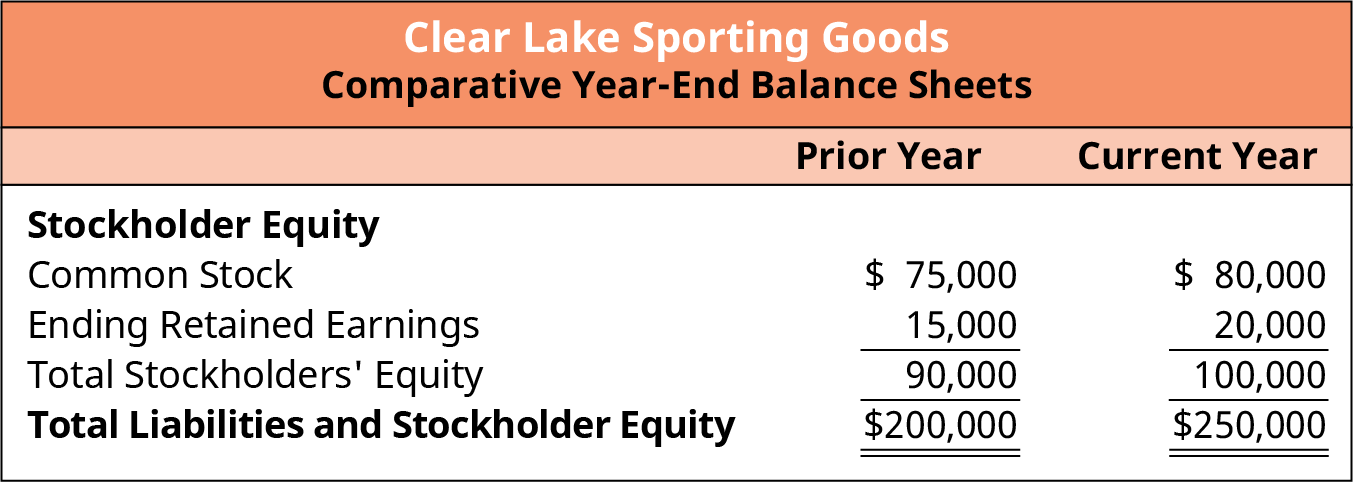
Figure 5.13 Stockholder Equity Section of Balance Sheet
THINK IT THROUGHEquity AccountsVisit the Apple, Inc. Annual Report (https://openstax.org/r/2020-doc-financial-annual-report) for 2020 and
locate the company’s balance sheet (it begins on page 33). What types of equity accounts does it report?Solution:Apple reports common stock, retained earnings, and accumulated other comprehensive income.
Distributions to Owners
When firms earn a profit, they have two options as to what to do with their earnings. They can keep (retain) them and reinvest them back into the business, or they can pay them out to their shareholders in the form of dividends. Dividends are commonly in the form of cash, but dividends can be paid out in the form of stock or other assets as well.
To pay a cash dividend, the firm must have enough cash on hand and sufficient retained earnings. They cannot pay out a dividend beyond the retained earnings available. Some companies issue shares of stock as a dividend rather than cash or property. This often occurs when the company has insufficient cash but wants to keep its investors happy. When a company issues a stock dividend, it distributes additional shares of stock to existing shareholders.
A property dividend occurs when the firm pays out dividends in the form of something other than stock or cash, often one of their assets or something they hold in inventory. For example, Walt Disney Company may choose to distribute tickets to visit its theme parks. A property dividend may be declared when a company wants to reward its investors but doesn’t have the cash to distribute, or if it needs to hold on to its existing cash for other investments.
Remember, the retained earnings account reflects the cumulative earnings of a firm since they began business, less dividends paid out to shareholders. This includes all forms of dividends (cash, stock, and other assets). Note that dividends are distributed or paid only to shares of stock that are outstanding. Treasury shares are not outstanding, so no dividends are declared or distributed for these shares. Regardless of the type of dividend, the declaration always causes a decrease in the retained earnings account.
THINK IT THROUGHDividendsVisit the Apple, Inc. Annual Report (https://openstax.org/r/2020-doc-financial-annual-report) for 2020. Review the notes to the financial statements found on pages 19 and 20. What kind of dividends did the company pay (cash, property, stock)? Review the notes regarding dividends on page 26. What does Apple intend to do regarding dividends in the future, pending board approval?Solution:Apple issued cash dividends. On page 26, it notes that the company intends to increase the dividend annually, pending approval by the board.
Elements of the Statement of Owner’s Equity
Now that we have covered the basic elements of equity and know what dividends are, we have the basic pieces we need to create the statement of owner’s equity. The statement is broken out into columns, one for each element of equity: common stock, preferred stock, additional paid-in capital, retained earnings, and treasury stock.
The first line of the statement provides the balance of each segment as of the first day of the period. Each
following line provides information on any events during the period that changed the value of any of the accounts. Common examples of events found on the statement include net income or loss for the period, issuing common or preferred stock, purchasing or selling treasury stock, and declaring a dividend.
Clear Lake Sporting Goods has just common stock and retained earnings to report in their statement of owner’s equity. They had just two events to report in their statement that impacted their equity accounts; they reported net income and they issued dividends (see Figure 5.14).
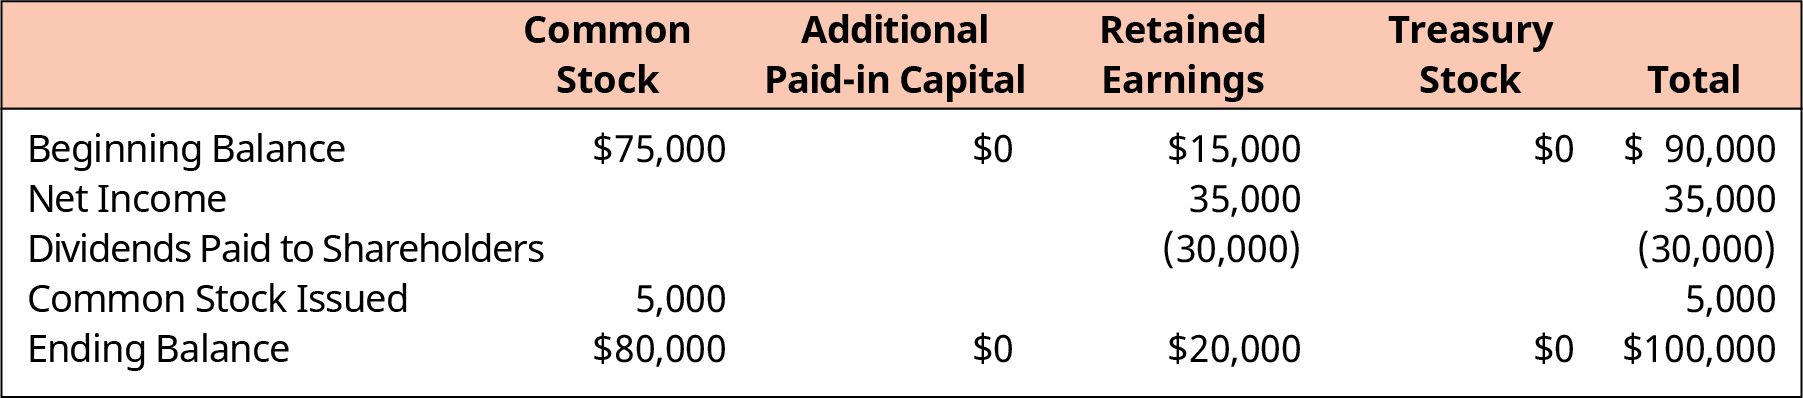
Figure 5.14 Statement of Stockholder Equity for Clear Lake Sporting Goods
LINK TO LEARNINGCash FlowsHYPERLINK “https://openstax.org/l/50CashFlowsVid” \hKhan Academy (https://openstax.org/l/50CashFlowsVid) explains cash flows in a unique way.
5.5
The Statement of Cash Flows
Learning Outcomes
By the end of this section, you will be able to:
- Outline the purpose and importance of the statement of cash flows.
- Identify the structure and key elements of the statement of cash flows.
The final financial statement is the statement of cash flows. It is a crucial statement, as it shows the sources of and uses of cash for the firm during the accounting period. Remember, under accrual accounting, transactions are recorded when they occur, not necessarily when cash moves. Thus, the income statement does not provide all the insights necessary to understand a firm’s cash flows. To fully understand the firm’s flow of cash, the statement of cash flows is needed.
Importance of the Statement of Cash Flows
Remember, most firms use accrual accounting. Revenues and expenses are recorded when they occur, not necessarily when cash moves. This can create timing differences between profits and cash flows. A firm can be profitable and still not have an adequate flow of cash. The opposite is also true: it can experience a net loss and still have cash on hand. Earning a profit is wonderful, but it is not the only goal an organization has. It must also have adequate cash flow to support daily operations. To support cash planning and to provide external financial statement users such as lenders and investors information about the firm’s cash flow, the statement of cash flows is prepared. Cash flow is also a crucial metric for determining the value of a company.
External financial statement users also rely on the statement of cash flows to help them evaluate the quality of the firm’s earnings. Users compare earnings to cash flow to assess the validity of the earnings data. For example, a firm reporting a strong profit but very little cash flow might raise some questions as to what was recorded to drive profits that isn’t also driving cash flows.
The statement of cash flows also helps external users determine the driving forces behind the firm’s cash flows. They can see if cash is generated primarily by daily operations or if cash is being generated or
consumed by events outside the firm’s normal course of business.
There are two key methods of preparing the statement: direct and indirect. FASB (Financial Accounting Standards Board) favors the direct method. Despite that, the most common method used by far in general practice is the indirect method. The direct method lists cash flows directly from revenues and expenses, whereas the indirect method reconciles income to cash flows. The indirect method begins with net income and reconciles each account in order to arrive at net cash flow. It essentially reconciles accrual basis accounting to cash basis, or cash flow.
Operating Activities
To provide clear information about what areas of the business generated and used cash, the statement of cash flows is broken down into three key categories: operating, financing, and investing. The operating section reflects cash flows generated by and used by the day-to-day operations of the business. Investing activities include investments in other firms as well as investments in the firm itself (items like machinery, land, or other fixed assets). Finally, financing activities are those used to provide funds to run the business (loans, interest).
As mentioned, operating activities are those that are used or generated by the day-to-day operations of the firm. The operating activities section of the statement of cash flows begins with net income. All lines thereafter, in that section, are then adjustments to reconcile net income to actual cash flows by adding back noncash expenses like depreciation and adjusting for changes in asset and liability accounts. For example, depreciation is a noncash expense. Thus, depreciation is added back to net income.
To prepare the statement of cash flows for Clear Lake Sporting Goods, we need the beginning cash balance from the balance sheet, net income and depreciation expense from the income statement, and a set of comparative balance sheets to see the change in asset and liability accounts (see Figure 5.15).
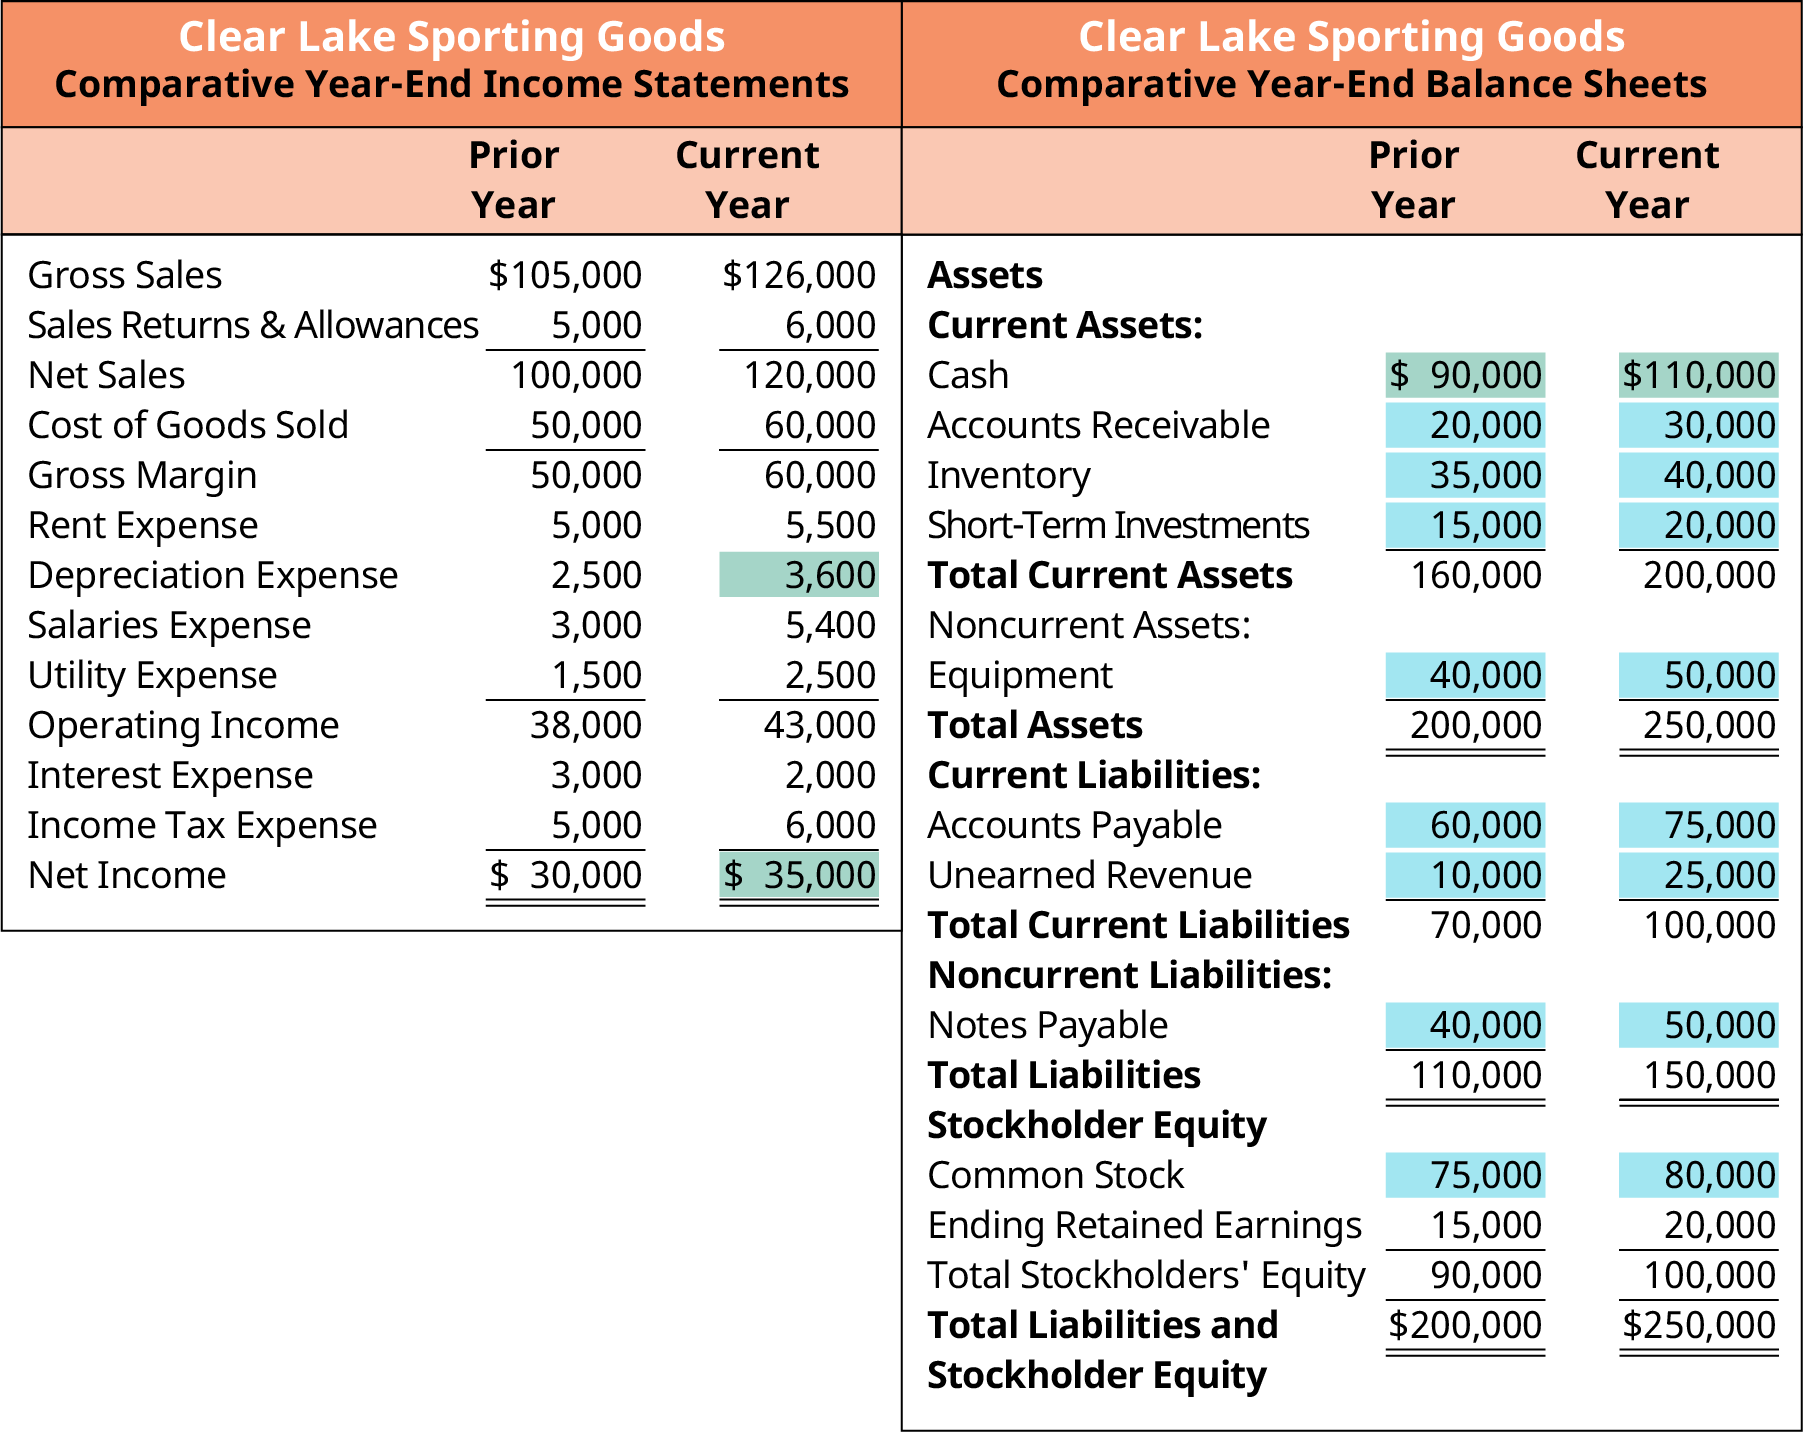
Figure 5.15 Comparative Income Statements and Balance Sheets
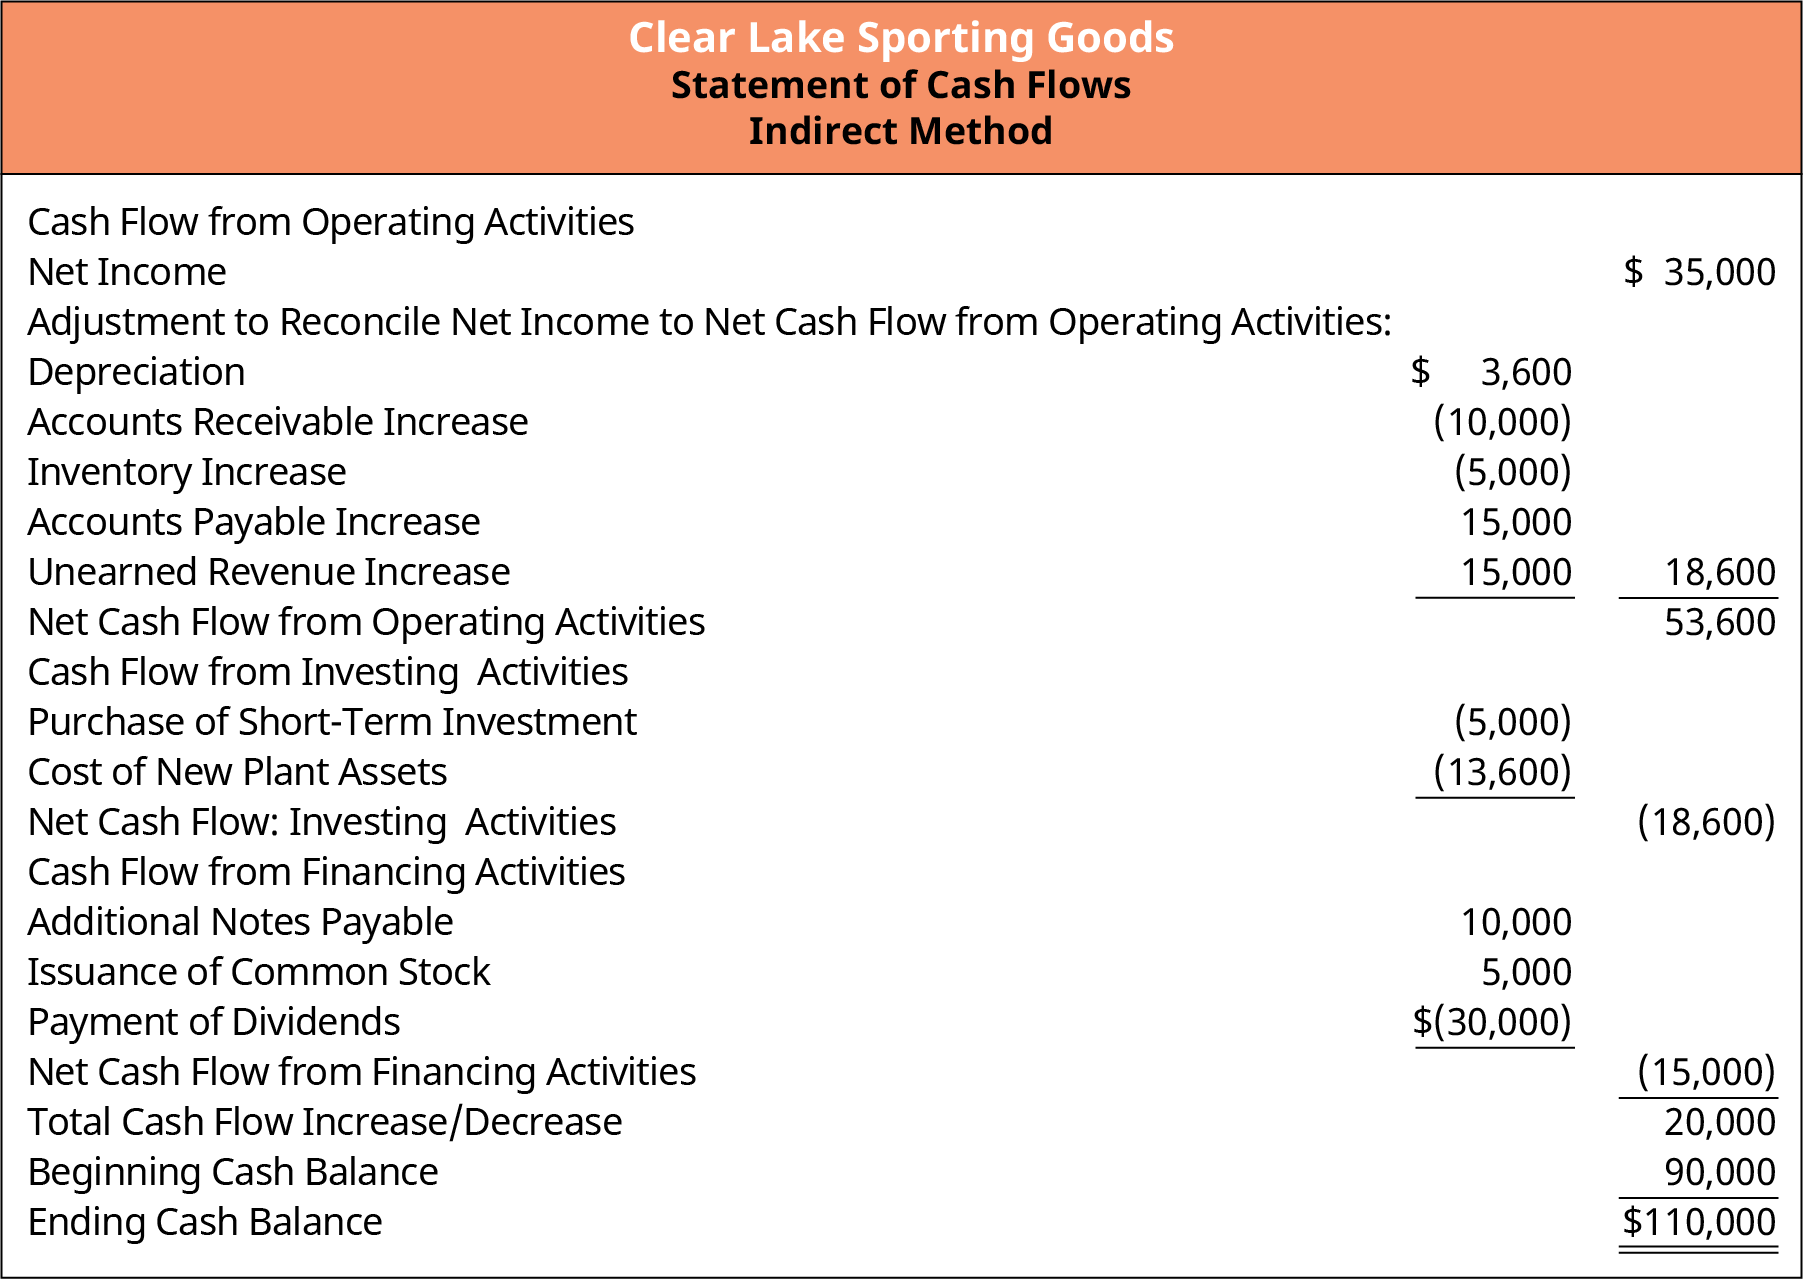
Clear Lake’s statement of cash flows begins with the current year net income of $35,000 from the income statement. Next, noncash expenses are deducted. Clear Lake’s only noncash expense on their current year income statement is depreciation of $3,600. Since deprecation is an expense that reduces income but is not actually paid out in cash in the current period, it must be added back to net income to reconcile net income to cash flow.
Next, changes in operational assets and liabilities are used to continue reconciling net income to actual cash flow. For example, Clear Lake’s accounts receivable increased from the prior period to the current period. This means that there were more sales recorded but not yet received in cash in this period than there were in the prior period, making an increase in accounts receivable a reduction on the statement. Inventory increased, which means additional cash was spent to acquire it, making it a use of cash or reduction to net income to move closer to cash. Accounts payable and unearned revenue, both liability accounts, increased. Since these are liabilities, an increase would indicate that the liability was incurred but not as quickly paid out; thus it is an increase to the statement.
Tallying all these adjustments to net income shows Clear Lake’s net cash flows provided by operating activities of $53,600 (see Figure 5.16).
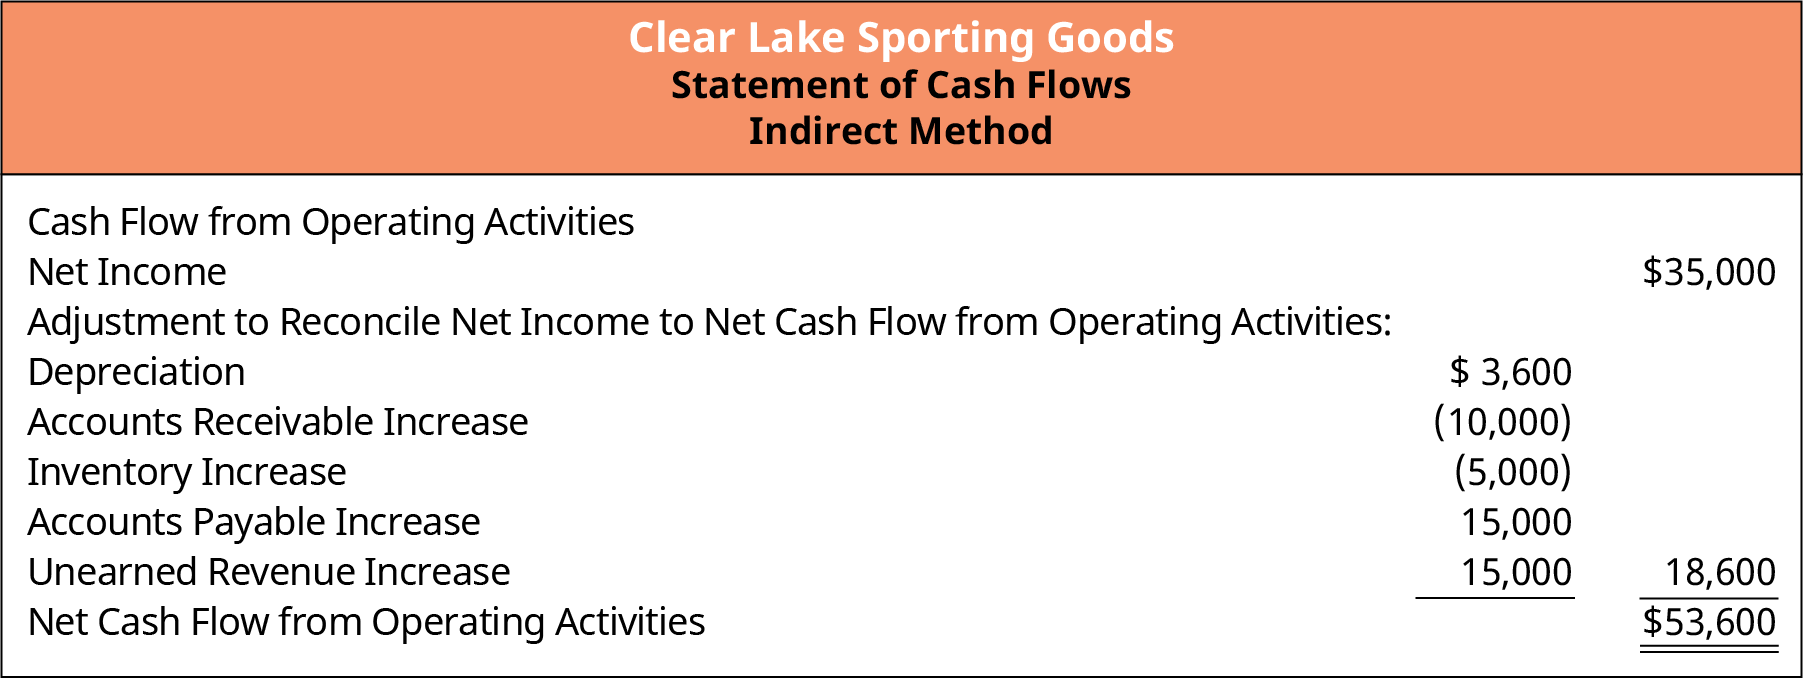
Figure 5.16 Operating Activities Section of the Statement of Cash Flows
Investing Activities
As mentioned, investing activities include investments in other firms as well as investments in the firm itself (items like machinery, land, or other fixed assets). These are items that are capitalized (placed on the balance sheet and depreciated over time) and thus did not reduce net income. They did, however, cause an impact to cash flow (see Figure 5.17).
During the current year, Clear Lake purchased an additional $5,000 in short-term investments (see the comparative balances sheets; the balance in that account increased by $5,000 since the prior year). They also purchased additional plant assets in the amount of $13,600. This amount can be figured by comparing the difference in the current and prior plant assets accounts and including the impact of current year depreciation ($50,000 current year balance less $40,000 prior year balance and $3,600 of depreciation = $13,600 of new assets purchased).
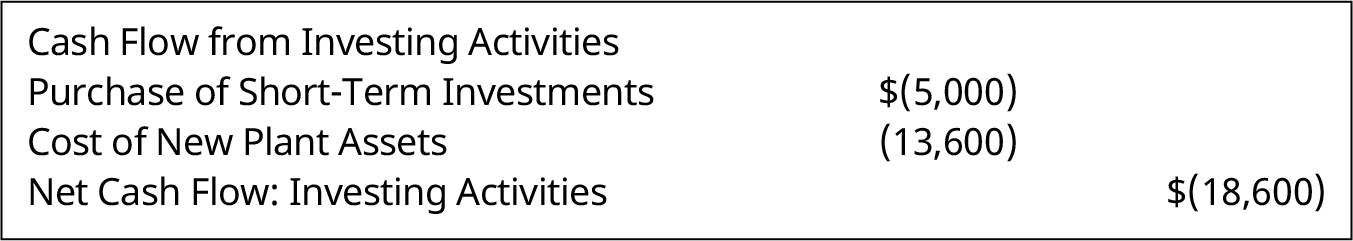
Figure 5.17 Investing Activities Section of the Statement of Cash Flows
Financing Activities
Recall that financing activities are those used to provide funds to run the business. Common items in this section of the statement include the payment of dividends, issuance of common or preferred stock, and issuance or payment of notes payable (see Figure 5.18).
In the current year, Clear Lake took out additional notes payable (a cash inflow). We can see this by the increase in their notes payable account from the prior year to current year ($40,000 to $50,000). This is an inflow of cash and thus an increase on the statement. Dividends of $30,000 were paid to shareholders (found on the statement of retained earnings and the statement of owner’s equity). Finally, we see that Clear Lake must have issued additional common stock, as their common stock balance increased from $75,000 to $80,000.
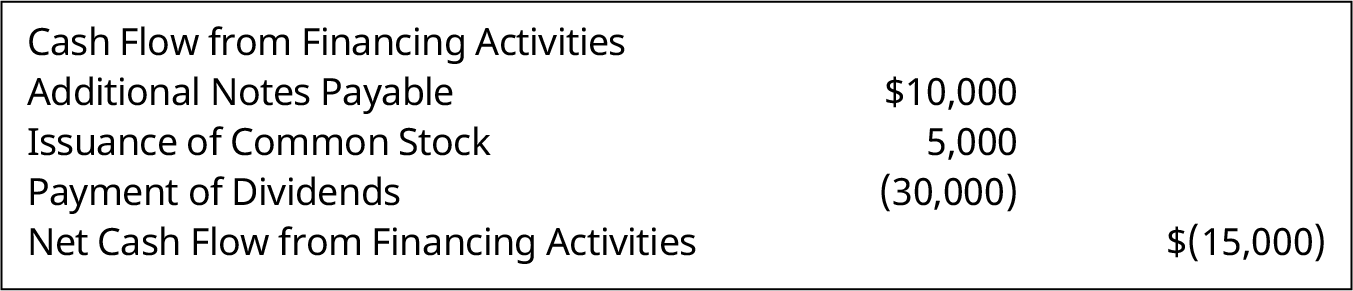
Figure 5.18 Financing Activities Section of the Statement of Cash Flows
LINK TO LEARNINGStatement of Cash FlowsVisit the Apple, Inc. Annual Report (https://openstax.org/r/2020-doc-financial-annual-report) for 2020 and locate the company’s statement of cash flows (it begins on page 35). What is the cash provided by/used by operating activities? Review the key adjustments in the operating section. What are the biggest adjustments? Review the investing section of the statement. Did the company have a net cash inflow or net cash used by investing? What key items appear in this section? What was the net cash provided by or used by financing activities? What key items appear in this section for Apple?
The final task to wrap up the statement of cash flows is to tally net cash generated or used by summing all three sections. This amount is then used to adjust the beginning cash balance from the balance sheet.
Assuming the statement was prepared correctly, the sum should equal the ending cash balance on the balance sheet.
In the full statement, we can see that Clear Lake has net cash flow of $20,000. The beginning cash balance was
$90,000, making the ending cash balance $110,000 (see Figure 5.19).
Analyzing Performance
Figure 5.19 Full Statement of Cash Flows
The statement of cash flows can be used in a number of ways to assess firm performance by both internal and external financial statement users. Internal users can assess sources of and uses of cash in order to aid in adapting, as necessary, to ensure adequate future cash flows. External users also use the statement. Recall that comparing net income to operational cash flows can help assess the quality of earnings. In the next section you’ll explore operating cash flow and free cash flow to the firm, two key points of analysis in
assessing cash flows.
5.6
Operating Cash Flow and Free Cash Flow to the Firm (FCFF)
Learning Outcomes
By the end of this section, you will be able to:
- Calculate operating cash flow and free cash flow.
- Assess organizational cash management performance.
Operating Cash Flow
Now that we have a statement of cash flows prepared, we can move on to a few key elements of the statement used to assess organizational cash management performance. Operating cash flow, or net cash flow from operating activities, is calculated in the first section of the statement of cash flows. It depicts the cash generated (or used by) the primary business activities. Remember, operating cash flow is calculated under the indirect method by adjusting net income for noncash expenses like depreciation and adjustments for changes in current asset and liability accounts (changes in working capital).

Operating cash flow is helpful in assessing organizational cash management performance as it relates to the core business function—operations. Key management practices in this area can have a profound impact on the firm’s cash flow. Practices and policies include customer payment terms, collection policies and practices, and vendor payment terms. Though changing a customer or vendor payment terms will not change the profit or loss for the firm, it will have an impact on the timing to cash flows. This is a key element of managing operational cash flow.
Free Cash Flow
Free cash flow (FCF) is calculated by taking operating cash flows less capital expenditures. Free cash flow is an important measure, as it depicts the cash available to support the business’s operations and maintain its fixed assets. It is commonly used by investors as part of their overall evaluation of an investment, as it is a key measure of cash flow management practices and a firm’s ability to generate enough cash to cover operations and capital assets and it shows if there is any left over for other considerations such as dividend payments, debt repayment, and contributions to increase working capital for future growth.

Using the data for Clear Lake Sporting Goods, we can calculate its free cash flow as follows:

This means that Clear Lake Sporting Goods has $40,000 of cash available to repay debt or pay cash dividends after having covered the cash needs of its operations and capital asset investments.
Managing Cash Flow
Managing cash flow is not an easy task. A firm has a myriad of places that its cash flows from or to. However, there are a few key areas to place attention in order to manage or improve cash flows. First, consider where cash is coming from—customers. Managing terms and collection efforts with customers can have a significant impact on a firm’s cash flow. For example, a customer with terms of net 10 will likely yield payment quite quickly—10 days, give or take. A customer with terms of net 60, on the other hand, will require roughly 60 days to collect assuming they pay on time. The 50-day difference between these two examples means that the firm will go 50 additional days having expended the resources to provide the customer their good or service, but with no cash flow yet to cover it.
The same theory holds true on the opposite side with accounts payable and the vendors a firm uses. Accepting
net 10 terms requires the firm to give up its cash quickly, while pushing for more favorable terms like net 30 or net 60 allows the firm to wait much longer to give up its cash.
It is important to assess both sides of cash flow and the impact it has on the firm as well as the customer and vendor relationships it maintains. Some customers may not have difficulty negotiating a more favorable payment term in order for the firm to improve its cash flow. Others, however, may not be willing to accept shorter payment terms. In order to be competitive in the industry, the firm must assess the customer relationships, industry standards, and its own ability to support cash flow when considering its customer payment terms.
When there is a gap in cash flow, it is crucial that it is recognized early, with proper cash flow forecasting, so financing can be obtained to bridge the gap. A common tool used to manage the ebb and flow of cash flow for a firm is an open line of credit with a bank. This allows the firm to borrow and repay from month to month as cash flow fluctuates.
Now that you’ve become more familiar with the four basic financial statements, let’s move on to a tool helpful in evaluating them: common-size statements. Common-size financial statements, also termed vertical analysis, restate the financial statement items as a percentage of a base item. Doing so helps reveal relationships between items, aids in assessing performance over time, and makes it easier to compare one company to another, regardless of size (thus the name common-size).
5.7
Common-Size Statements
Learning Outcomes
By the end of this section, you will be able to:
- Prepare common-size statements.
- Assess organizational performance using common-size statements.
- Use industry comparisons to assess organizational performance.
Common-Size Income Statements
A common-size income statement is created by restating each line as a percentage of net sales. Expressing each item on the income statement as a percentage rather than in absolute dollars makes it much easier to make comparisons, particularly to other divisions or competitors of varying sizes. The formula to calculate each item on the income statement is:

Using Clear Lake Sporting Goods’ current year income statement, we can see how each line item in it is divided by net sales in order to assemble a common-size income statement (see Figure 5.20).
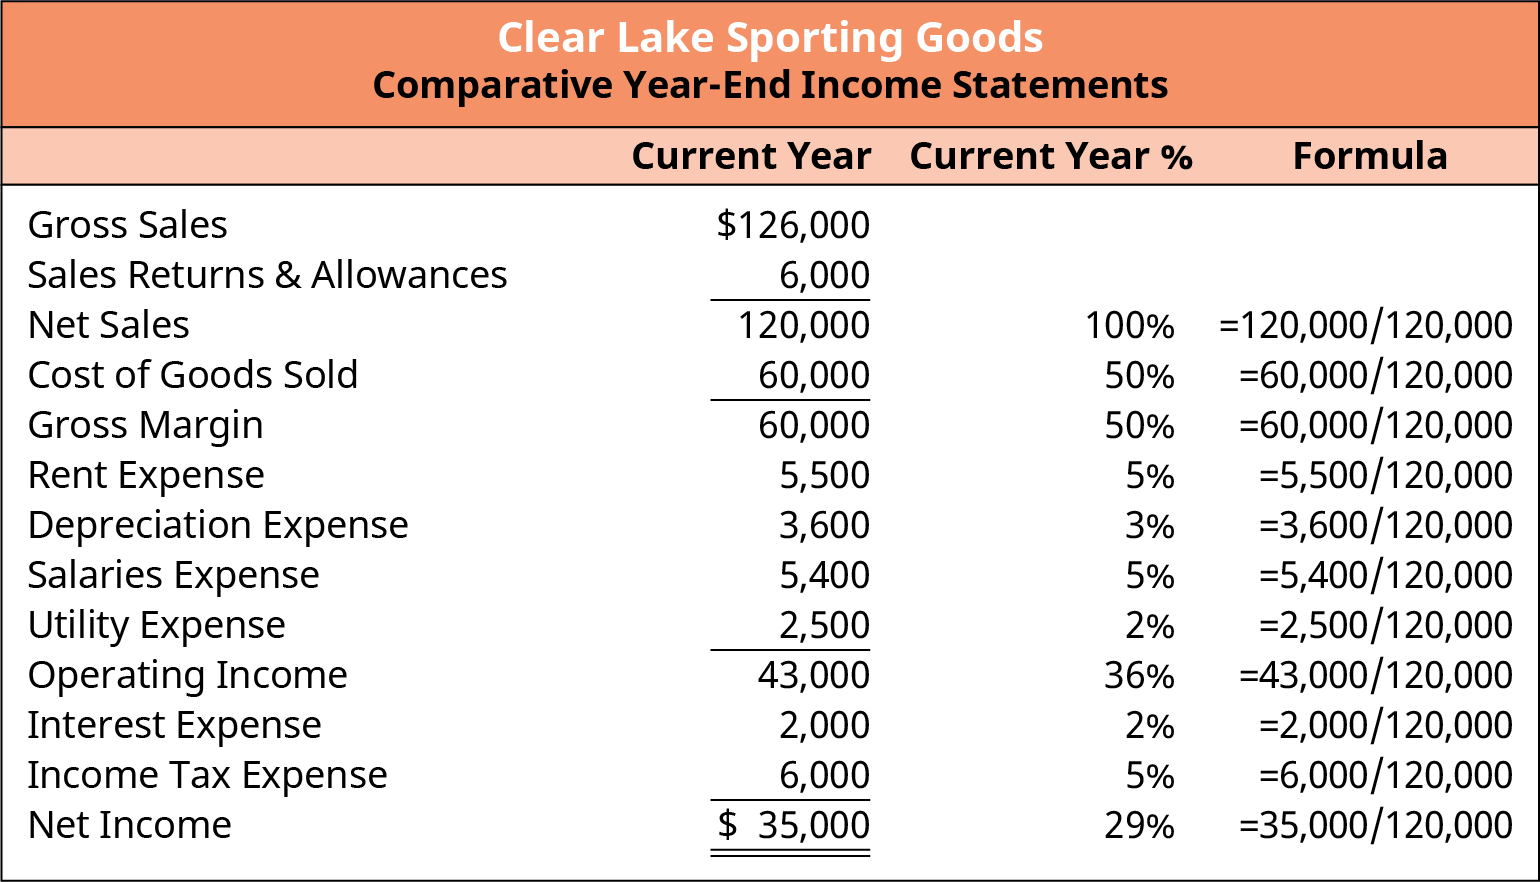
Figure 5.20 Common-Size Income Statement
It may seem cumbersome to create a common-size statement. However, a simple tool like Microsoft Excel can be quite handy in making the process easier and faster. The same formula can be copied and replicated in each income statement line, making the calculations much faster. In Figure 5.21, you can see the formulas used to create Clear Lake Sporting Goods’ common-size income statement in Excel. Notice that the $ can be inserted to anchor a cell reference, making it easier to copy and paste the same formula onto many lines or columns.
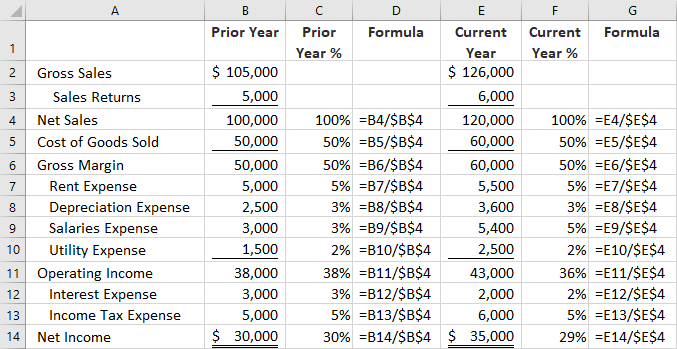
Figure 5.21 Clear Lake Sporting Goods Common-Size Income Statements with Excel Formulas
Common-Size Balance Sheet
The common-size balance sheet functions much like the common-size income statement. Each line item on the balance sheet is restated as a percentage of total assets.

Using Clear Lake Sporting Goods’ current balance sheet, we can see how each line item in its statement is divided by total assets in order to assemble a common-size balance sheet (see Figure 5.22).
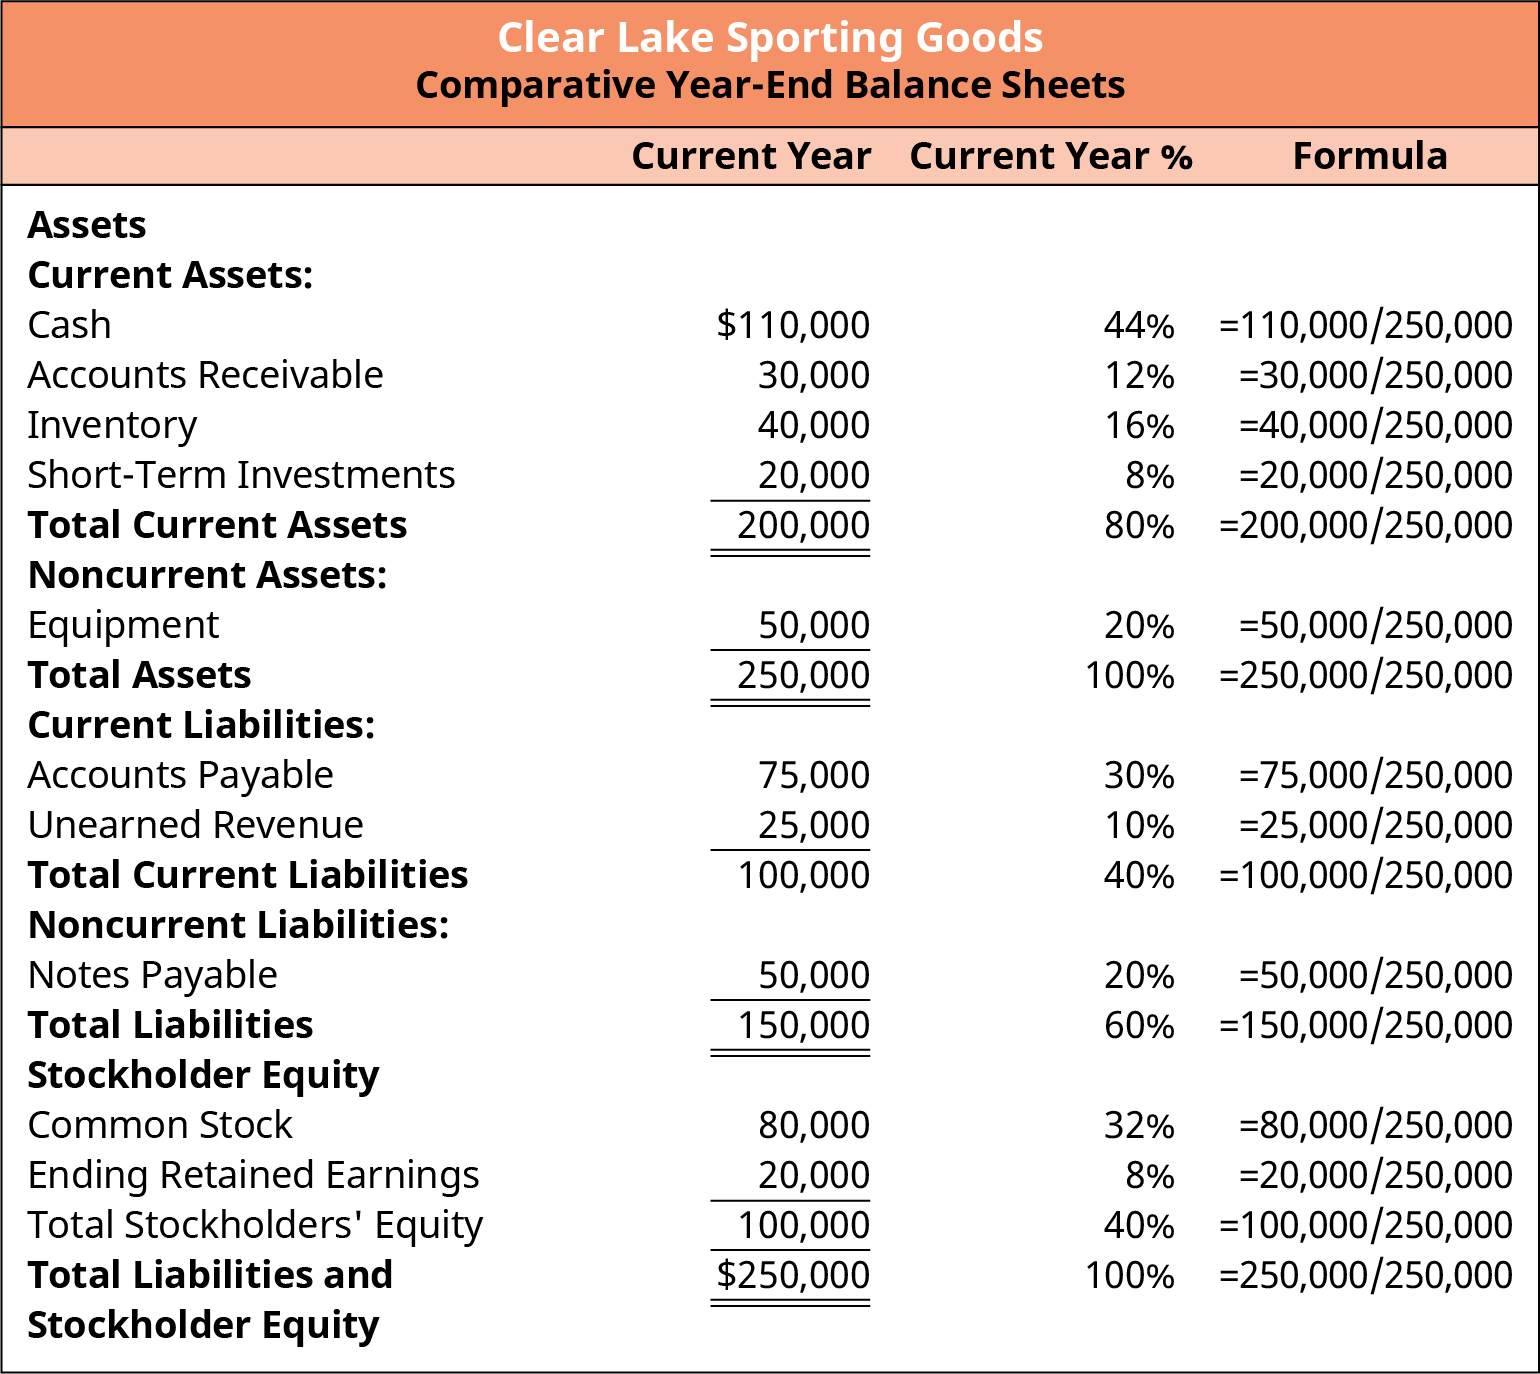
Figure 5.22 Common-Size Balance Sheet
Excel can also be used to create a common-size balance sheet. Once the formula is created, it can be copied into each line, making the process to create a common-size statement much easier (see Figure 5.23):
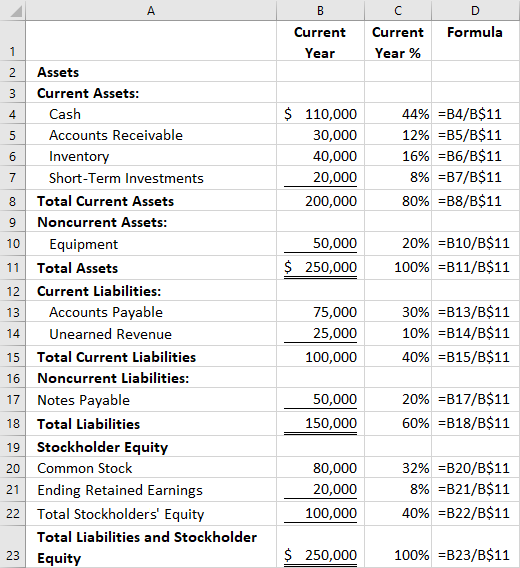
Figure 5.23 Common-Size Balance Sheet with Excel Formulas
It is important to note that while we have provided two years of data here to explore the process, when performing analysis for a firm or investment, several years of data are commonly used to provide a better view of historical performance.
Analyzing Organizational Performance
Common-size financial statements facilitate the analysis of financial performance by converting each element of the statements to a percentage. This makes it easier to compare figures from one period to the next, compare departments within an organization, and compare the firm to other companies of any size as well as industry averages. On the income statement, analysts can see how much of sales revenue is spent on each type of expense. They can see this breakdown for each firm and compare how different firms function in terms of expenses, proportionally. They can also look at the percentage for each expense over time to see if they are spending more or less on certain areas of the business, such as research and development. On the balance sheet, analysts commonly look to see the percentage of debt and equity to determine capital structure. They can also quickly see the percentage of current versus noncurrent assets and liabilities.
In Clear Lake Sporting Goods’ common-size income statement for the current and prior years, we can see that cost of goods as a percentage of sales remained the same (see Figure 5.24). This means that while sales
increased, so did cost of goods sold, but it increased at the same proportion as sales. No improvement or decline occurred in the company’s cost of goods sold. The same is true for rent, depreciation, and utilities expenses. One key item did change slightly as a percentage: salaries expense. The 2 percent decrease in operating income from the prior year’s 38 percent to the current year’s 36 percent was caused by the increase in salaries expense as a percentage of sales.
Net income, however, only declined by 1 percent from 30 percent in the prior year to 29 percent in the current year because interest expense dropped by 1 percent, offsetting the 2 percent increase in salaries expense.
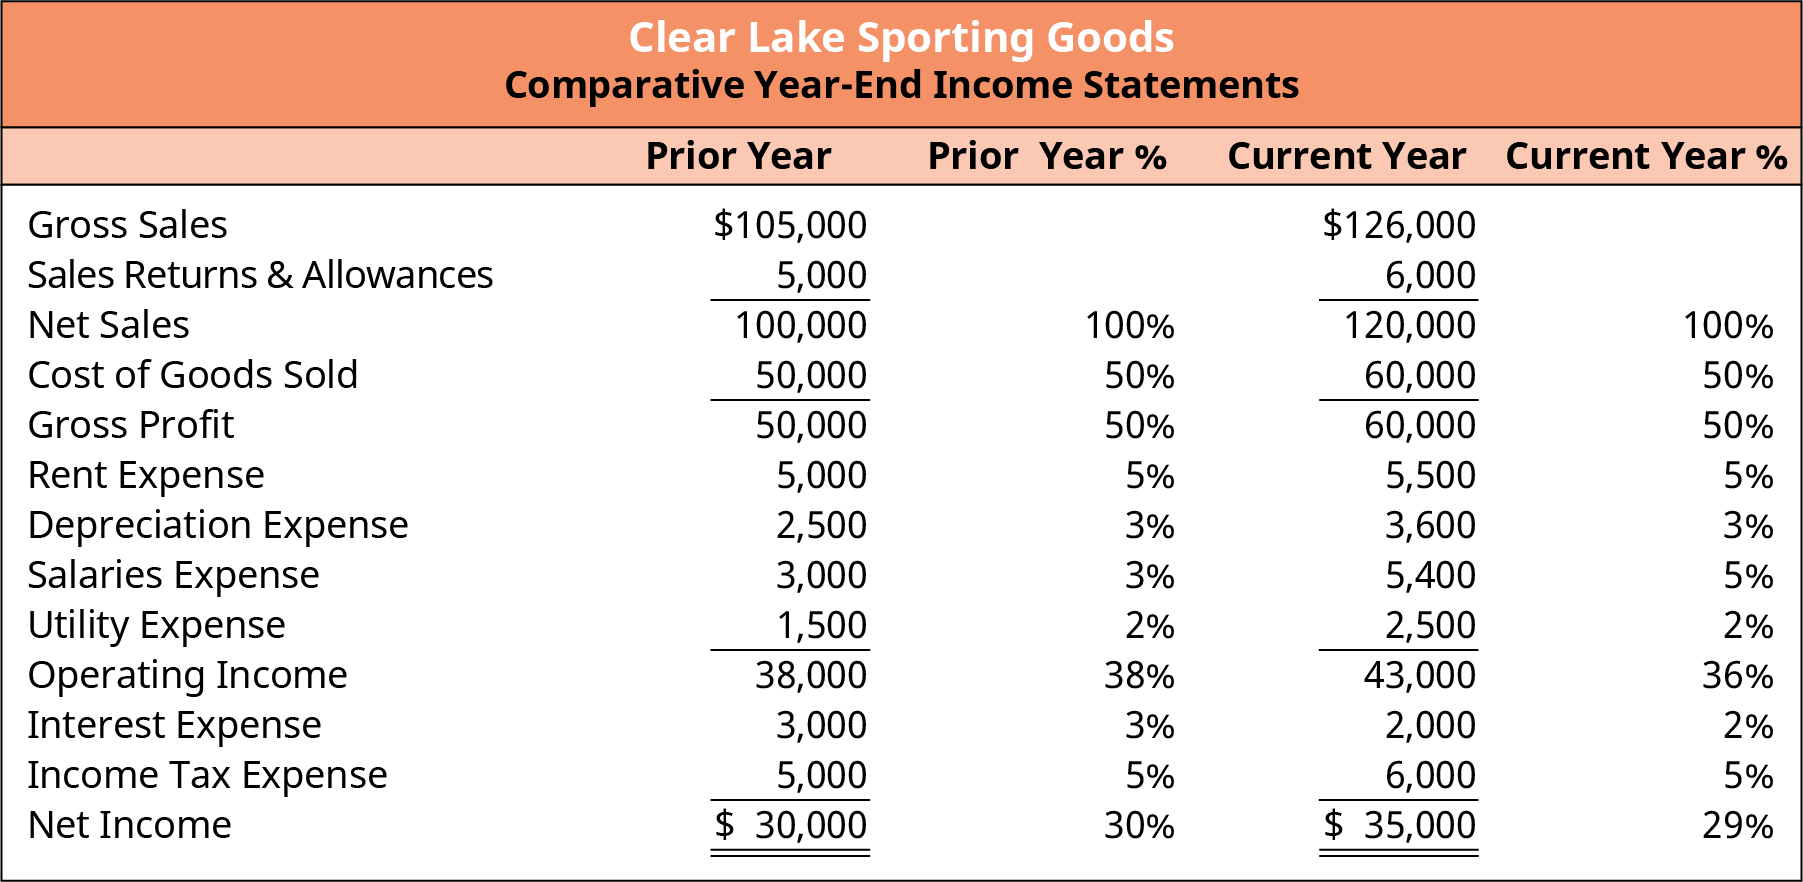
Figure 5.24 Common-Size Income Statement
LINK TO LEARNINGCommon-Size Income StatementVisit the Apple, Inc. Common-Size Income Statement (https://openstax.org/r/common-size-income- statement) provided by the Stock Analysis on Net website. Review the company’s cost of sales, gross profit, operating income, other income, and net income percentages for the current and prior year. What can you learn about the company’s recent performance in these areas? Has it improved or declined, or has it simply changed incrementally with gross sales?
On the Clear Lake Sporting Goods’ common-size balance sheet, we see that current assets remained at 80 percent of total assets from the prior to current year (see Figure 5.25). The mix of current assets that comprise that 80 percent changed only slightly with a 1 percent decrease in cash, 2 percent increase in accounts receivable, 2 percent decrease in inventory, and no change in short-term investments. Noncurrent assets includes only equipment. While the balance in the equipment account did change as a percentage of total assets, equipment remained the same at 20 percent.
On the debt and equity side of the balance sheet, however, there were a few percentage changes worth noting. In the prior year, the balance sheet reflected 55 percent debt and 45 percent equity. In the current year, that balance shifted to 60 percent debt and 40 percent equity. The firm did issue additional stock and showed an increase in retained earnings, both totaling a $10,000 increase in equity. However, the equity increase was much smaller than the total increase in liabilities of $40,000. Long-term debt increased by only
$10,000 by issuing additional notes payable. The remainder of that increase is seen in the 5 percent increase in current liabilities. In that increase, most of it was in unearned revenue.
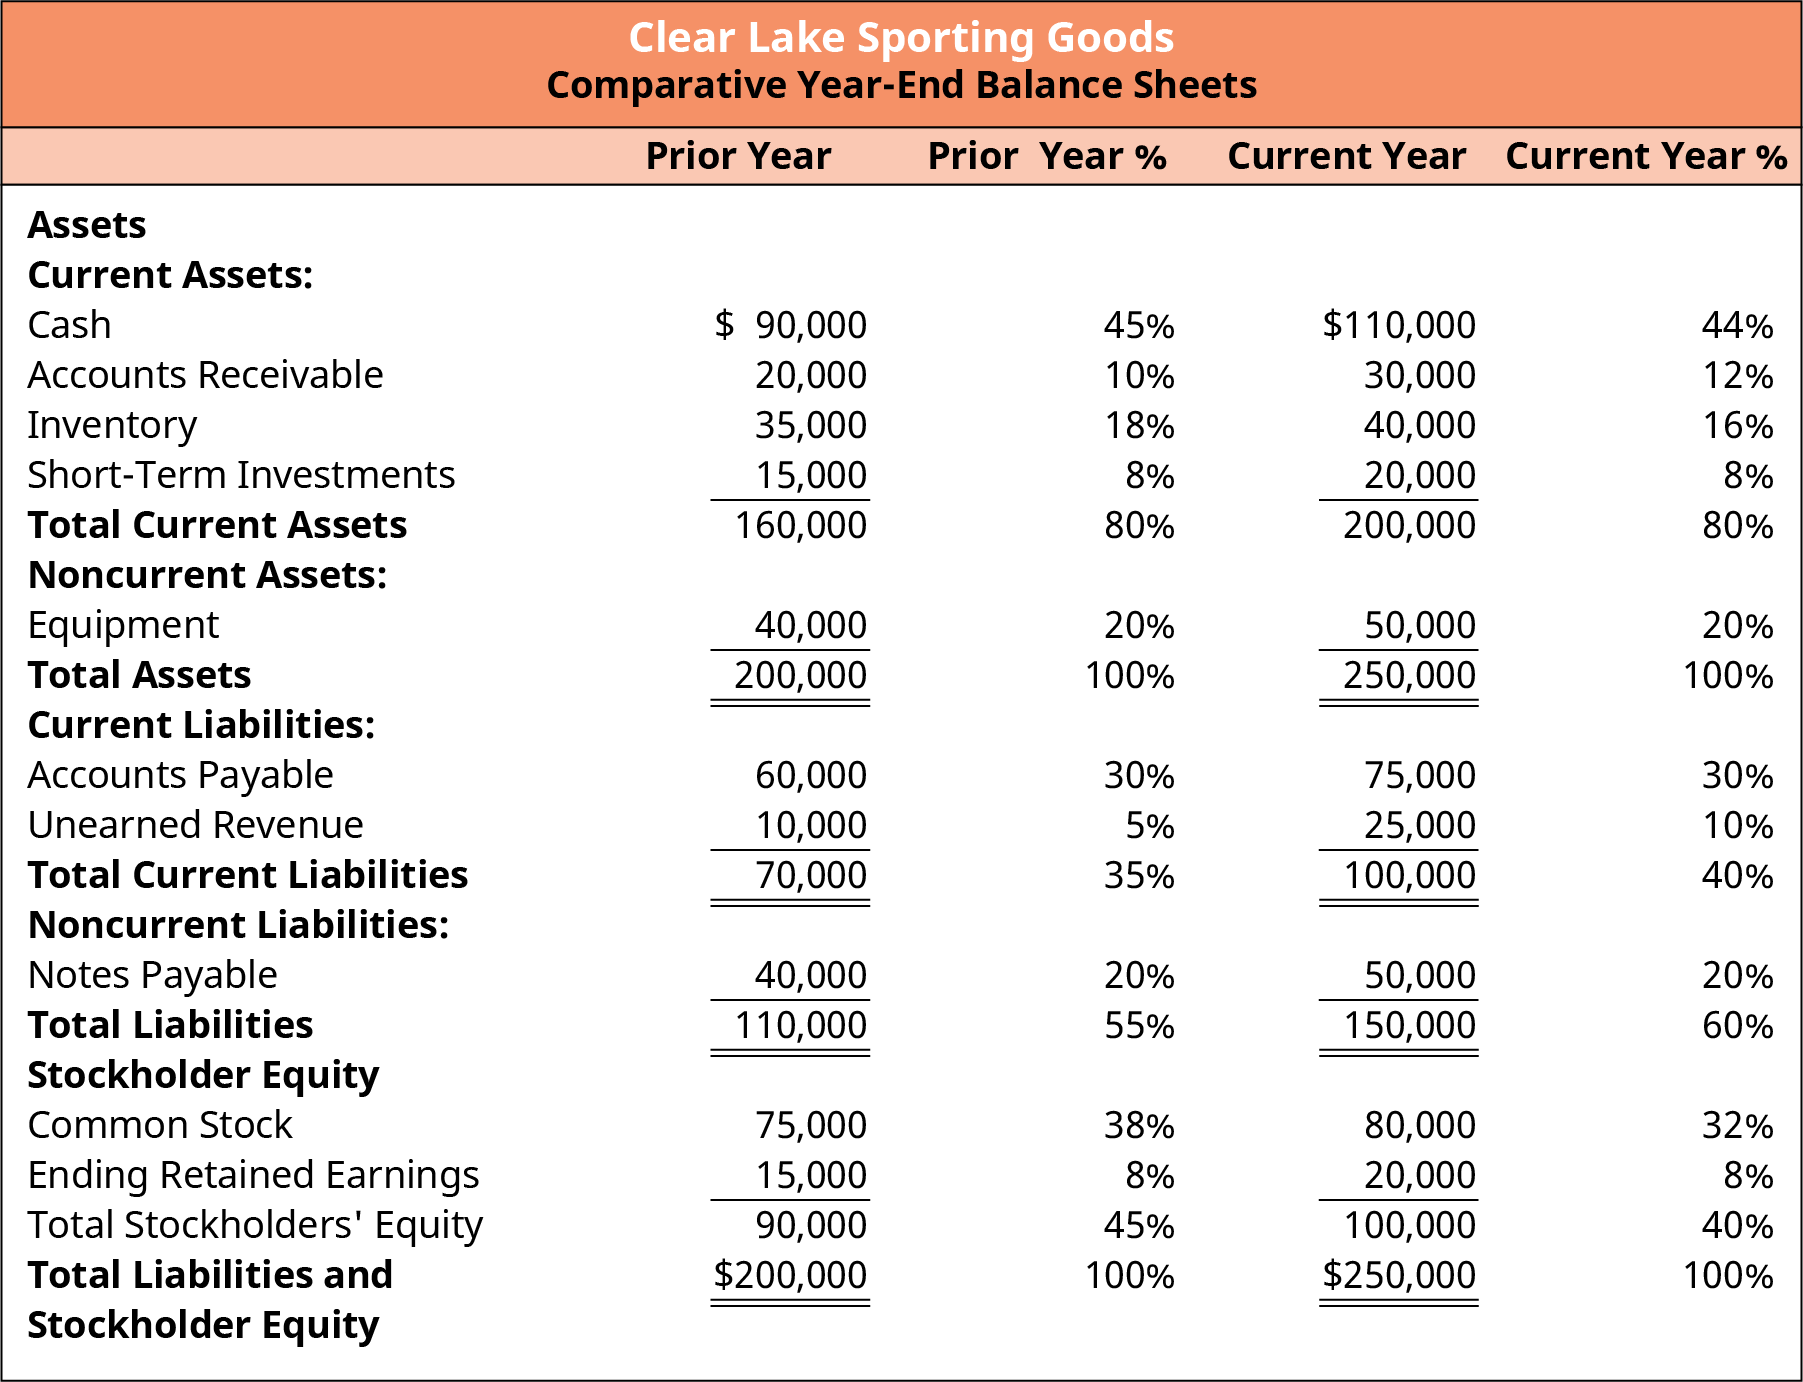
Figure 5.25 Common-Size Balance Sheet
LINK TO LEARNINGCommon-Size Assets and Common-Size Liabilities and EquityVisit the Apple, Inc. Common-Size Assets (https://openstax.org/r/common-size-assets) Balance Sheet and Common-Size Liabilities and Equity (https://openstax.org/r/common-size-liabilities) Balance Sheet provided by the Stock Analysis on Net website. Review the composition of the company’s assets, liabilities, and equity. How have assets changed? Has capital structure changed? If so, what elements impacted the change?
Industry Comparison
Recall that a key benefit of common-size analysis is comparing the firm’s performance to the industry. Expressing the figures on the income statement and balance sheet as percentages rather than raw dollar figures allows for comparison to other companies regardless of size differences.
Clear Lake Sporting Goods, for example, might compare their financial performance on their income statement to a key competitor, Charlie’s Camping World. Charlie is a much bigger retailer for outdoor gear, as Charlie has nearly seven times greater sales than Clear Lake. Common-size statements allow Clear Lake to compare their statements in a meaningful way (see Figure 5.26). Notice that Clear Lake spends 50 percent of its sales on cost of goods sold while Charlie spends 59 percent. This is a significant difference that would be an indicator that Clear Lake and Charlie have key differences in their operations, purchasing policies, or general performance in their core products.
We know that Charlie is a bigger retailer, and we see this clearly in the rent expense as a percentage of sales. Charlie spends 11 percent of its sales on building rent, while Clear Lake spends only 5 percent. A clear difference in performance is hinted at here, alluding to Charlie spending more per square foot on rent or using its retail space differently, causing it to rent more space for its product per sales dollar than Clear Lake does.
Depreciation expense, though not a large figure, is smaller for Charlie, giving us a hint that Charlie has less capital equipment than Clear Lake, perhaps tied to the higher rent expense. It is possible that Charlie rents some of its equipment, which would help explain the higher rent percentage. Finally, Charlie’s salaries percentage is significantly higher at 12 percent than Clear Lake’s 5 percent. Though the simple percentage does not tell us why, it does provide us a hint and allow for further questions or investigation. Charlie may pay its employees a much higher wage than Clear Lake. They may also have far more sales associates on the floor in their larger spaces than Clear Lake does in their smaller retail spaces.
Note that although we have compared just two years of data for Charlie and Clear Lake, it is more common to use several years of data to get a more robust view of long-term trends.
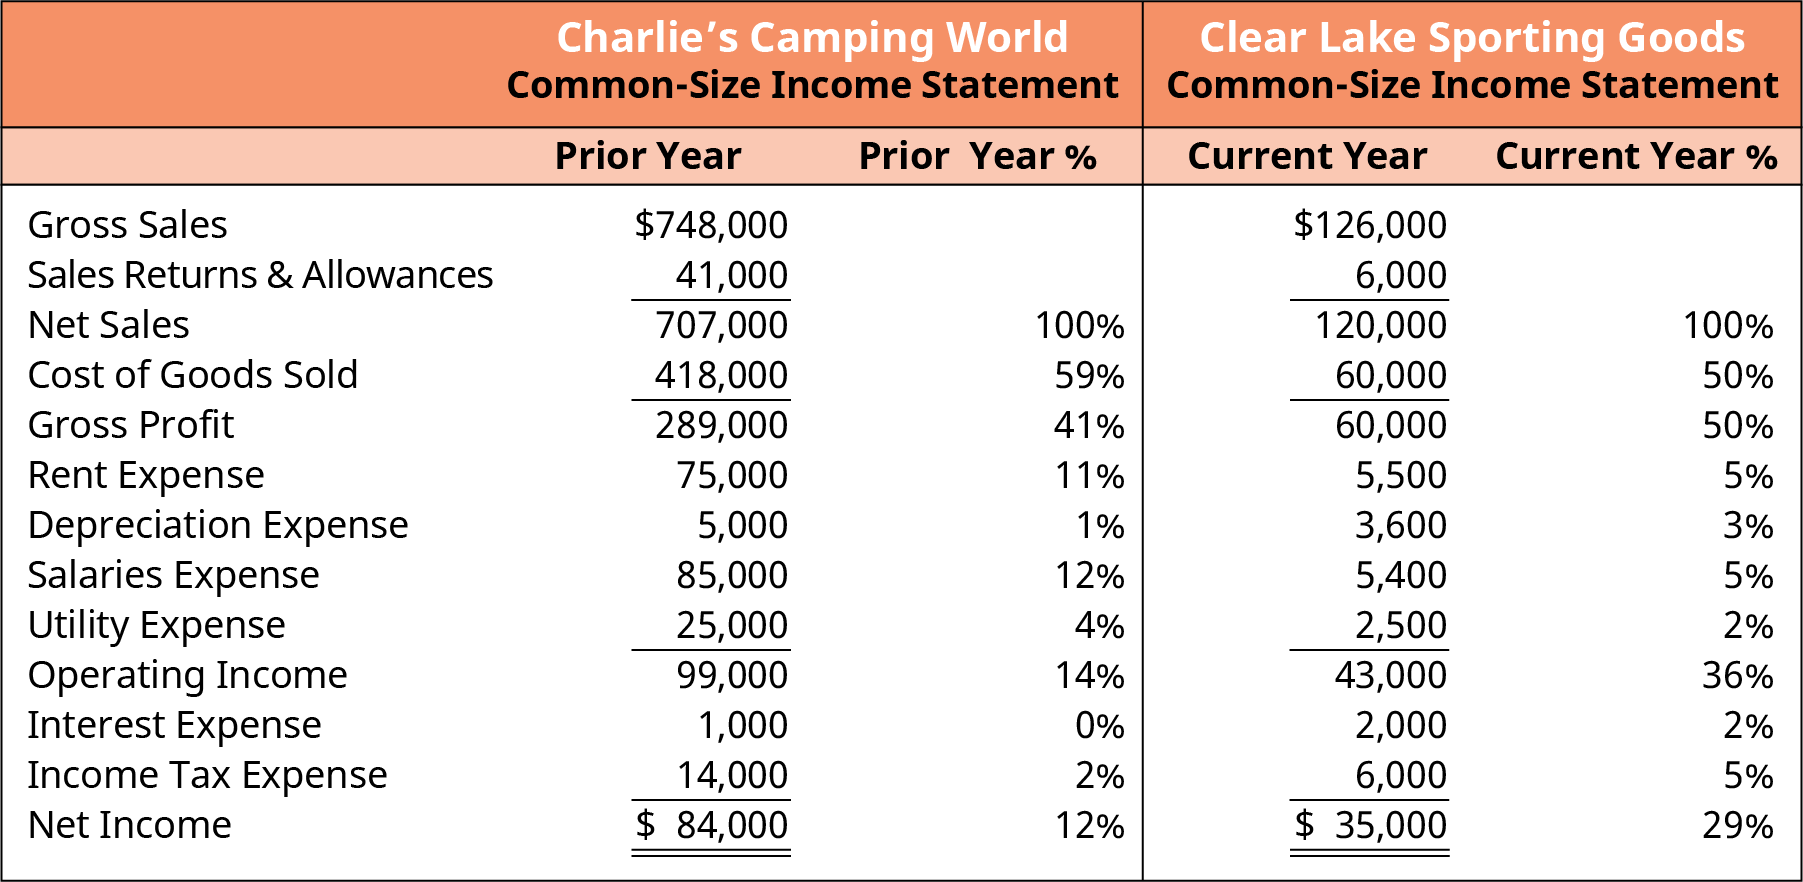
Figure 5.26 Comparison of Common-Size Income Statements
LINK TO LEARNINGMicrosoft versus AppleLocate the sales, cost of goods sold, and gross profit data for Microsoft (https://openstax.org/r/microsoft- financial)’s most current period using Yahoo! Finance. Calculate the common-size percentage for cost of goods sold and gross profit (cost of goods sold divided by net sales, and gross profit divided by net sales). Compare these percentages to those of Apple, Inc (https://openstax.org/r/common-size-income- statement)., a key competitor, on its common-size income statement. What can you learn about the performance of each firm based on these two percentages?
Now that you have covered the basic financial statements and a little bit about how they are used, where do we find them? How often are they prepared? Who gets them? In this next section we will explore the requirements for what needs to be reported, when, and to whom.
5.8
Reporting Financial Activity
Learning Outcomes
By the end of this section, you will be able to:
- Identify the most common types of accounting periods.
- Outline key considerations and accounting principles that dictate the timing of financial reporting.
- Describe the SEC reporting requirements relevant to financial statements.
- Identify the key elements of a company annual report.
Defining Accounting Periods
An accounting period can be any period of time, but the most common accounting periods are months, quarters, and a year. Accounting periods are important, particularly in accrual accounting, so there are clear cutoffs for recording transactions.
It is important to note that Generally Accepted Accounting Principles (GAAP) require companies to provide quarterly financial statements. However, most firms, even those not covered by GAAP, prepare financial statements monthly in order to provide timely data to their financial statement users both internally and externally.
Time Period Principle
Providing information to financial statement users in a timely fashion brings us to our next key topic, which is the time period principle. In order for information to be useful, it must be timely. This means that financial statement users need to get the statements quickly enough to be able to make relevant decisions with them. Providing statements on a timely basis is the foundation of the time period accounting principle.
Fiscal versus Calendar Year
Though a firm may present financial statements monthly, quarterly, and annually, not all time periods are created equal. Firms have the option to choose between a fiscal and a calendar year. The calendar year, which begins January 1 and ends December 31, is the traditional year we are accustomed to. The calendar year, however, doesn’t always work well with a firm’s business cycle. Due to seasonality or other factors, a firm may choose to adopt a fiscal year with their own beginning and end date. For example, a firm may choose to start its fiscal year on June 1 and end it on May 31. A firm can opt to change from a fiscal to a calendar year or vice versa but must only do so for a justifiable reason.
THINK IT THROUGHFiscal versus Calendar YearVisit the Apple, Inc. Annual Report (https://openstax.org/r/2020-doc-financial-annual-report) for 2020 and review the title of the table of contents on page 1. The title reads “Apple Inc. Form 10-K.” The next line provides information on the company’s chosen time period. Does Apple use a fiscal or calendar year?Solution:Apple uses a fiscal year. Their fiscal year ended on September 26, 2020.
The Annual Report
An annual report is part of the 10-K filing that publicly traded firms must provide to the SEC and investors each year. The report details the firm’s operations and performance for the year and its current financial conditions. The report contains general company information, the firm’s financial statements, notes to the financial
statements, various required disclosures pertaining to accounting policies, the management discussion and analysis (MD&A) statement, a letter from the CEO to the shareholders, and the firm’s audit report.
THINK IT THROUGHAnnual Report Key ElementsVisit the Apple, Inc. Annual Report (https://openstax.org/r/2020-doc-financial-annual-report) for 2020 and review the title of the table of contents on page 1. What key elements would you be drawn to review if you were a potential investor? In Part II of the table of contents, find the MD&A report (page 20) and use the table of contents link to navigate to it. What key highlights and challenges did the company report for the year?Solution:Answers may vary. A few key items of note might include risk factors, financial statements, the MD&A letter, and disclosures about market risk. Apple’s MD&A reported significant updates on the impact of theCOVID-19 pandemic, a few financial updates, product updates, segment performance data, a conversation about its debt, contractual obligations, and accounting policies.
SEC Reporting Requirements
The Securities and Exchange Commission (SEC) requires publicly traded firms to regularly provide several reports. The two most common are the 10-K and quarterly report (10-Q). Certain unique events also require an additional filing called an 8-K. There are many events that might require reporting. A few key examples include changes to rights of shareholders, changes in control of the company, and amendments to the company charter or bylaws.
The quarterly report is much like the annual report already discussed. It contains the firm’s financial statements, required accounting disclosures, statements on internal control, and a management discussion and analysis (MD&A) letter. It does not contain an auditor’s report, as firms are not audited on a quarterly basis. Quarterly reports are helpful to investors because they provide information on a timely enough basis to be relevant.
LINK TO LEARNINGInvestor RelationsVisit the Apple, Inc. Investor Relations page, SEC Filings section (https://openstax.org/r/sec-filings). Notice how many different reports Apple files regularly with the SEC. Locate the most recent quarterly (10-Q) and annual reports (10-K) and scan the table of contents. How does the quarterly report differ from the annual report? Do you notice key items in the annual report not provided in the quarterly report?
 Summary
The Income Statement
The income statement reflects a firm’s performance over a period of time. Most financial statements are prepared monthly, quarterly, and annually. The income statement reflects sales less cost of goods sold to arrive at gross profit. Operating costs are deducted to arrive at operating income. Finally, other nonoperational costs like interest and taxes are deducted to arrive at net income.
The Balance Sheet


The balance sheet reflects the financial position of a firm as of a particular point in time. It is laid out to clearly depict and support the accounting equation: A classified balance sheet breaks down the assets and liabilities sections into current and noncurrent for greater transparency.
The Relationship between the Balance Sheet and the Income Statement
The financial statements are all tied together. The income statement is generated first, as net income is needed in order to determine the ending balance of retained earnings, a key account in the equity section of the balance sheet.
The Statement of Owner’s Equity
The statement of owner’s equity is divided by each type of equity the firm has: common stock, preferred stock, additional paid-in capital, and retained earnings, for example. Beginning balances are provided, and all key transactions impacting equity are provided in order to show how ending balance were derived. Key transactions commonly include recording net income or loss, issuing additional stock, and paying out dividends.
The Statement of Cash Flows
Under accrual accounting, transactions are recorded when they occur, not necessarily when cash moves. This creates a timing difference. Net profit, therefore, does not necessarily mean a firm has cash, and a net loss doesn’t mean they don’t have any cash. To reconcile net income to actual cash flow and see how a firm generates and uses its funds, a statement of cash flows is prepared. The statement reflects cash flow from operating activities, financing activities, and investing activities.
Operating Cash Flow and Free Cash Flow to the Firm (FCFF)
Operating cash flow reflects the cash generated by (or used by) the core business function. Free cash flow to the firm (FCFF) or simply free cash flow (FCF) is calculated by deducting capital expenditures from operating cash flow. FCF reflects the cash available to repay debts, pay dividends to shareholders, and contribute to cash needs for growth.
Common-Size Statements
Common-size statements are a restatement of the financial statements with all dollar figures restated as a percentage. On the income statement, each line is restated as a percentage of net sales. On the balance sheet, each line is restated as a percentage of total assets. Common-size statements are useful for analysis and are particularly helpful in comparing firms of different sizes.
Reporting Financial Activity
Publicly traded firms must file company and financial data with the Securities and Exchange Commission (SEC) on a regular basis. Key reports include the quarterly report, called a 10-Q, and the annual report, called a 10-K.
 Key Terms
accounting equation 
accrual basis accounting system in which revenue is recorded or recognized when earned yet not necessarily received, and in which expenses are recorded when legally incurred and not necessarily when paid
assets tangible or intangible resources owned or controlled by a company, individual, or other entity with the intent that they will provide economic value
cash basis method of accounting in which transactions are not recorded in the financial statements until there is an exchange of cash
current assets asset typically used up, sold, or converted to cash in one year or less
current liabilities debt or obligation due within one year or, in rare cases, a company’s standard operating cycle, whichever is greater
depreciation process of allocating the costs of a tangible asset over the asset’s economic life
direct method approach used to determine net cash flows from operating activities, whereby accrual basis revenue and expenses are converted to cash basis collections and payments
dividends portion of the net worth (equity) that is returned to owners of a corporation as a reward for their investment
expenses costs associated with providing goods or services
free cash flow operating cash, reduced by expected capital expenditures
gains increases in organizational value from activities that are “incidental or peripheral” to the primary purpose of the business
income statement financial statement that measures the organization’s financial performance for a given period of time
indirect method approach used to determine net cash flows from operating activities, starting with net income and adjusting for items that impact new income but do not require outlay of cash
liabilities probable future sacrifice of economic benefits arising from present obligations of a particular entity to transfer assets or provide services to other entities in the future as a result of past transactions or events
loss decrease in organizational value from activities that are “incidental or peripheral” to the primary purpose of the business
net income revenues and gains that are greater than expenses and losses
noncash expenses expenses that reduce net income but are not associated with a cash flow; most common example is depreciation expense
noncurrent assets assets used in the normal course of business for more than one year that are not intended to be resold
noncurrent liabilities liabilities that are expected to be settled in more than one year
owner’s equity residual interest in the assets of an entity that remains after deducting its liabilities retained earnings cumulative, undistributed net income or net loss for the business since its inception revenue inflows or other enhancements of assets of an entity or settlements of liabilities from delivering or
producing goods, rendering services, or other activities that constitute the entity’s ongoing major or central operations
statement of cash flows financial statement listing the cash inflows and cash outflows for the business for a period of time