14 Lesson 9 Cost of Capital
The most important job that company managers have is to maximize the value of the company. Some obvious things come to mind when you think of how managers would do this. For example, to maximize the value of American Airlines, the managers need to attract customers and sell seats on flights. They also need to keep costs as low as possible, which means keeping the costs of purchasing fuel and making plane repairs as low as possible. While the concept of keeping costs low is simple, the specific decisions a firm makes can be complex. If American Airlines wants to purchase a new airplane, it needs to consider not just the dollar cost of the initial purchase but also the passenger and cargo capacity of the plane as well as ongoing maintenance costs.
In addition to paying salaries to its pilots and flight attendants, American Airlines must pay to use investors’ money. If the company wants to purchase a new airplane, it may borrow money to pay for the plane. Even if American Airlines does not need to incur debt to buy the plane, the money it uses to buy the plane ultimately belongs to the owners or shareholders of the company. The company must consider the opportunity cost of this money and the return that shareholders are expecting on their investments.
Just as different planes have distinctive characteristics and costs, the different types of financing that American Airlines can use will have different characteristics and costs. One of the tasks of the financial manager is to consider the trade-offs of these sources of funding. In this chapter, we look at the basic principles that managers use to minimize the cost of funding and maximize the value of the firm.
 17.1
17.1
The Concept of Capital Structure
By the end of this section, you will be able to:
- Distinguish between the two major sources of capital appearing on a balance sheet.
- Explain why there is a cost of capital.
- Calculate the weights in a company’s capital structure.
The Basic Balance Sheet
In order to produce and sell its products or services, a company needs assets. If a firm will produce shirts, for example, it will need equipment such as sewing machines, cutting boards, irons, and a building in which to store its equipment. The company will also need some raw materials such as fabric, buttons, and thread. These items the company needs to conduct its operations are assets. They appear on the left-hand side of the balance sheet.
The company has to pay for these assets. The sources of the money the company uses to pay for these assets appear on the right-hand side of the balance sheet. The company’s sources of financing represent its capital. There are two broad types of capital: debt (or borrowing) and equity (or ownership).

 Figure 17.2 is a representation of a basic balance sheet. Remember that the two sides of the balance sheet must be
 . Companies typically finance their assets through equity (selling ownership shares to stockholders) and debt (borrowing money from lenders). The debt that a firm uses is often referred to as financial leverage. The relative proportions of debt and equity that a firm uses in financing its assets is referred to as its capital structure.
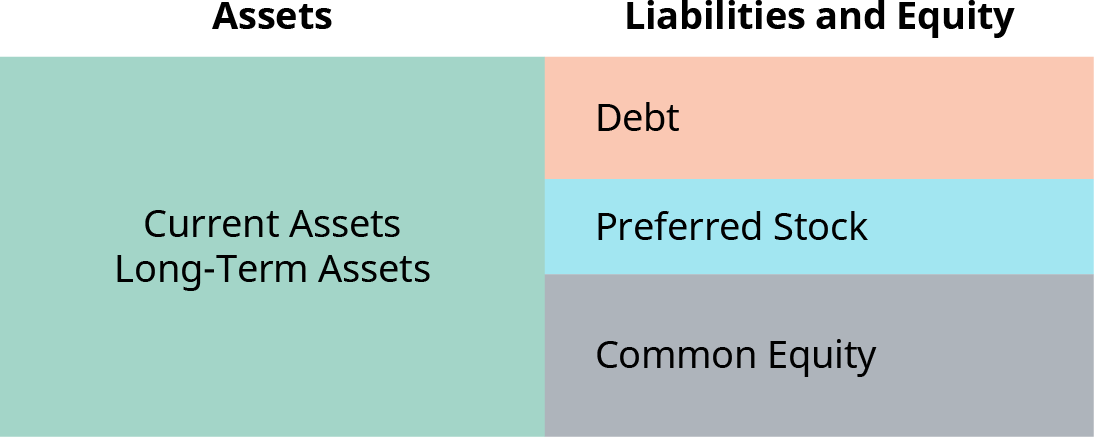
Figure 17.2 Basic Balance Sheet for Company with Debt, Preferred Stock, and Common Equity in Capital Structure
Attracting Capital
When a company raises money from investors, those investors forgo the opportunity to invest that money elsewhere. In economics terms, there is an opportunity cost to those who buy a company’s bonds or stock.
Suppose, for example, that you have $5,000, and you purchase Tesla stock. You could have purchased Apple stock or Disney stock instead. There were many other options, but once you chose Tesla stock, you no longer had the money available for the other options. You would only purchase Tesla stock if you thought that you would receive a return as large as you would have for the same level of risk on the other investments.
From Tesla’s perspective, this means that the company can only attract your capital if it offers an expected return high enough for you to choose it as the company that will use your money. Providing a return equal to what potential investors could expect to earn elsewhere for a similar risk is the cost a company bears in exchange for obtaining funds from investors. Just as a firm must consider the costs of electricity, raw materials, and wages when it calculates the costs of doing business, it must also consider the cost of attracting capital so that it can purchase its assets.
Weights in the Capital Structure
Most companies have multiple sources of capital. The firm’s overall cost of capital is a weighted average of its
debt and equity costs of capital. The average of a firm’s debt and equity costs of capital, weighted by the fractions of the firm’s value that correspond to debt and equity, is known as the weighted average cost of capital (WACC).
The weights in the WACC are the proportions of debt and equity used in the firm’s capital structure. If, for example, a company is financed 25% by debt and 75% by equity, the weights in the WACC would be 25% on the debt cost of capital and 75% on the equity cost of capital. The balance sheet of the company would look like Figure 17.3.
These weights can be derived from the right-hand side of a market-value-based balance sheet. Recall that accounting-based book values listed on traditional financial statements reflect historical costs. The market- value balance sheet is similar to the accounting balance sheet, but all values are current market values.
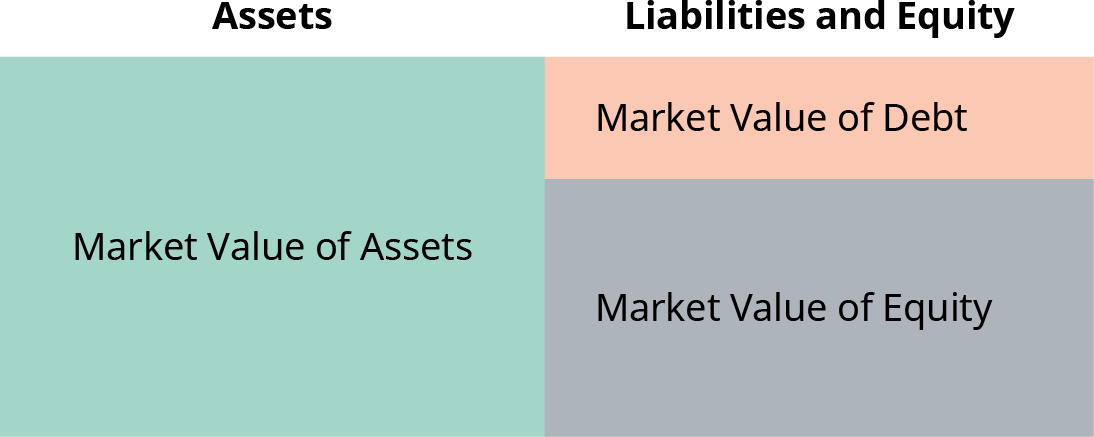
Figure 17.3 Balance Sheet of Company with Capital Structure of 25% Debt and 75% Equity
Just as the accounting balance sheet must balance, the market-value balance sheet must balance:


This equation reminds us that the values of a company’s debt and equity flow from the market value of the company’s assets.
Let’s look at an example of how a company would calculate the weights in its capital structure. Bluebonnet Industries has debt with a book (face) value of $5 million and equity with a book value of $3 million.
Bluebonnet’s debt is trading at 97% of its face value. It has one million shares of stock, which are trading for
$15 per share.
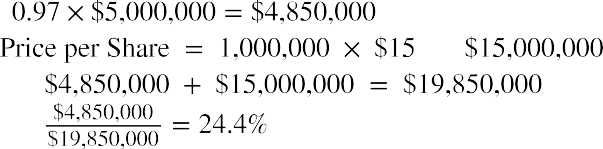

 First, the market values of the company’s debt and equity must be determined. Bluebonnet’s debt is trading at a discount; its market value is. The market value of Bluebonnet’s equity equals. Thus, the total market
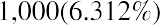
value of the company’s capital is. The weight of debt in
17.2
Bluebonnet’s capital structure is. The weight of equity in its capital structure is 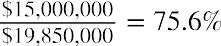 .
.
The Costs of Debt and Equity Capital
By the end of this section, you will be able to:
- Calculate the after-tax cost of debt capital.
- Explain why the return to debt holders is not the same as the cost to the firm.
- Calculate the cost of equity capital.
The costs of debt and equity capital are what company lenders (those who allow the firm to use their capital) expect in return for providing that capital. Just as current market values of debt and equity should be used in determining their weights in the capital structure, current market values of debt and equity should be used in determining the costs of those types of financing.
Cost of Debt Capital
A company’s cost of debt is the interest rate it would have to pay to refinance its existing debt. Because a firm’s existing debt trades in the marketplace, its price changes according to market conditions. The overall credit environment can change due to changing macroeconomic conditions, causing a change in the price of debt securities. In addition, as there are changes in the overall riskiness of the firm and its ability to repay its creditors, the price of the debt securities issued by the firm will change.
The market price of a company’s existing bonds implies a yield to maturity. Recall that the yield to maturity is the return that current purchasers of the debt will earn if they hold the bond to maturity and receive all of the payments promised by the borrowing firm.
Yield to Maturity and the Cost of Debt
Bluebonnet’s debt is selling for 97% of its face value. This means that for every $100 of face value, investors are currently paying $97 for an outstanding bond issued by Bluebonnet Industries. This debt has a coupon rate of 6%, paid semiannually, and the bonds mature in 15 years.
Because the bonds are selling at a discount, the yield that investors who purchase these bonds will receive if they hold the bond to maturity exceeds 6%. The purchasers of these bonds will receive a coupon payment of


 every six months for the next 15 years. They will also receive the $100 face value when the
bonds mature in 15 years. To calculate the yield to maturity of these bonds using your financial calculator, input the information shown in Table 17.1.
 Step123456DescriptionEnter number of coupon payments Enter the price paid for the bond Enter the coupon paymentEnter the face value of the bondCompute the semiannual rate Multiply 3.156 by 2 to get YTMEnterDisplay30 N N =97 +/- PV PV =3 PMT PMT =100 FV FV =CPT I/Y I/Y =30.00-97.003.00100.003.1566.312
Table 17.1 Calculator Steps for Finding the Yield to Maturity1
The yield to maturity (YTM) of Bluebonnet Industries bonds is 6.312%. This YTM should be used in estimating the firm’s overall cost of capital, not the coupon rate of 6% that is stated on the outstanding bonds. The coupon rate on the existing bonds is a historical rate, set under economic conditions that may have been different from the current market conditions. The YTM of 6.312% represents what investors are currently requiring to purchase the debt issued by the company.
After-Tax Cost of Debt
Although current debt holders demand to earn 6.312% to encourage them to lend to Bluebonnet Industries, the cost to the firm is less than 6.312%. This is because interest paid on debt is a tax-deductible expense. When a firm borrows money, the interest it pays is offset to some extent by the tax savings that occur because of this deductible expense.

 The after-tax cost of debt is the net cost of interest on a company’s debt after taxes. This after-tax cost of debt is the firm’s effective cost of debt. The after-tax cost of debt is calculated as
 , whereis the before-tax cost of debt, or the return that the lenders receive, and T is the company’s tax rate. If Bluebonnet
- The specific financial calculator in these examples is the Texas Instruments BA II PlusTM Professional model, but you can use other financial calculators for these types of calculations.

 Industries has a tax rate of 21%, then the firm’s after-tax cost of debt is
 This means that for every $1,000 Bluebonnet borrows, the company will have to pay its lenders


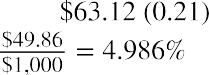

 in interest every year. The company can deduct $63.12 from its income, so this interest payment reduces the taxes the company must pay to the government by. Thus, Bluebonnet’s effective cost of debt is, or.

THINK IT THROUGH
Calculating the After-Tax Cost of Debt
Royer Roasters has issued bonds that will mature in 18 years. The bonds have a coupon rate of 8%, and coupon payments are made semiannually. These bonds are currently selling at a price of $102.20 per $100 face value. Royer’s tax rate is 28%. What is Royer’s after-tax cost of debt?
Solution:
The purchasers of these bonds will receive a coupon payment ofevery six months for the next 18 years. The owners of the bonds will also receive the $100 face value when the bonds mature in
18 years. To calculate the yield to maturity of these bonds, input the information in Table 17.2 in your financial calculator.
- Enter number of coupon payments36 N N =36.00
- Enter the price paid for the bond102.20 +/- PV PV =-102.20
- Enter the coupon payment4 PMT PMT =4.00
- Enter the face value of the bond100 FV FV =100.00
- Compute the semiannual rateCPT I/Y I/Y =3.885
- Multiply 3.885 by 2 to get YTM7.771
Table 17.2 Calculator Steps to Find Bond Yield to Maturity
The bondholders require 7.771% to entice them to purchase the debt issued by the company. Royer Roasters is able to deduct interest expenses before taxes. Thus, its after-tax cost of debt is
Cost of Equity Capital
Companies can raise money by selling stock, or ownership shares, of the company. Stock is known as equity capital. The cost of common stock capital cannot be directly observed in the market; it must be estimated. Two primary methods for estimating the cost of common stock capital are the capital asset pricing model (CAPM) and the constant dividend growth model.
CAPM
The CAPM is based on using the firm’s systematic risk to estimate the expected returns that shareholders require to invest in the stock. According to the CAPM, the cost of equity (re) can be estimated using the formula


For example, suppose that Bluebonnet Industries has an equity beta of 1.3. Because the beta is greater than


one, the stock has more systematic risk than the average stock in the market. Assume that the rate on 10-year US Treasury notes is 3% and serves as a proxy for the risk-free rate. If the long-run average return for the stock market is 11%, the market risk premium is this means that people who invest in the stock market are rewarded for the risk they are taking by being paid 8% more than they would have been paid if they had purchased US Treasury notes. Bluebonnet Industries cost of equity capital can be estimated as


Constant Dividend Growth Model
The constant dividend growth model provides an alternative method of calculating a company’s cost of equity. The basic formula for the constant dividend growth model is

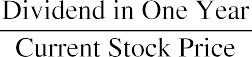


Thus, three things are needed to complete this calculation: the current stock price, what the dividend will be in one year, and the growth rate of the dividend. The current price of the stock is easy to obtain by looking at the financial news. The other two items, the dividend next year and the growth rate of the dividend, will occur in the future and at the current time are not known with certainty; these two items must be estimated.
Suppose Bluebonnet paid a dividend of $1.50 per share to its shareholders last year. Also suppose that this dividend has been growing at a rate of 2% each year for the past several years and that growth rate is expected to continue into the future. Then, the dividend in one year can be expected to be


 . If the current stock price is $12.50 per share, then that cost of equity is estimated
as


 THINK IT THROUGHUsing the Constant Dividend Growth ModelWhat does an increase in the price of a company’s stock imply about the equity cost of capital for the company? To find out what the constant dividend growth model suggests, assume that the stock price for Bluebonnet Industries increases to $16.50 per share. If there is no expectation that the growth rate of the dividends will increase, what would the new estimated equity cost of capital be?Solution:Using the price of $16.50 per share in the constant dividend growth model equation results in an estimated equity cost of capital ofThus, an increase in the price of the stock, holding all of the other variables in the equation constant, implies that the equity cost of capital drops to 11.27%.
17.3
Calculating the Weighted Average Cost of Capital
By the end of this section, you will be able to:
- Calculate the weighted average cost of capital (WACC).
- Describe issues that arise from estimating the cost of equity capital.
- Describe the use of net debt in calculating WACC.
Once you know the weights in a company’s capital structure and have estimated the costs of the different sources of its capital, you can calculate the company’s weighted average cost of capital (WACC).
WACC Equation


 WACC is calculated using the equation


D%, P%, and E% represent the weight of debt, preferred stock, and common equity, respectively, in the capital structure. Note thatmust equal 100% because the company must account for 100% of its financing. The after-tax cost of debt is. The cost of preferred stock capital is represented by rpfd, and the cost of common stock capital is represented by re.


For a company that does not issue preferred stock, P% is equal to zero, and the WACC equation is simply


Earlier in this chapter, we calculated the weights in Bluebonnet Industries’ capital structure to be


 and. We also calculated the after-tax cost of debt for Bluebonnet to be 4.99%. If we use the CAPM to estimate the cost of equity capital for the firm, Bluebonnet’s WACC is computed as


If we use the constant dividend discount model to estimate the cost of equity for Bluebonnet Industries, the WACC is computed as


Calculating WACC in Practice
The equation for calculating WACC is straightforward. However, issues come up when financial managers calculate WACC in practice. Both the weights of the equity components and the cost of the equity components are needed to calculate the WACC. The WACC that financial managers derive will depend on the assumptions and models they use to determine what weights and capital costs to use.
Issues in Estimating the Cost of Equity Capital
We have explored two ways of estimating the cost of equity capital: the CAPM and the constant dividend growth model. Often, these methods will produce similar estimates of the cost of capital; seldom will the two methods provide the same value.
In our example for Bluebonnet Industries, the CAPM estimated the cost of equity capital as 13.4%. The constant dividend growth model estimated the cost of capital as 14.24%. The exact value of the WACC calculation depends on which of these estimates is used. It is important to remember that the WACC is an estimate that is based on a number of assumptions that financial managers made.
For example, using the CAPM requires assumptions be made regarding the values of the risk-free interest rate, the market risk premium, and a firm’s beta. The risk-free interest rate is generally determined using US Treasury security yields. In theory, the yield on US Treasury securities that have a maturity equivalent to the length of the company’s investors’ investment horizon should be used. It is common for financial analysts to use yields on long-term US Treasury bonds to determine the risk-free rate.
To estimate the market risk premium, analysts turn to historical data. Because this historical data is used to estimate the future market risk premium, the question arises of how many years of historical data should be used. Using more years of historical data can lead to more accurate estimates of what the average past return has been, but very old data may have little relevance if today’s financial market environment is different from what it was in the past. Old data may have little relevance for investors’ expectations today. Typical market risk premiums used by financial managers range from 5% to 8%.
The same issue with how much historical data should be considered arises when calculating a company’s beta. Different financial managers can calculate significantly different betas even for well-established, stable companies. In April 2021, for example, the beta for IBM was reported as 0.97 by MarketWatch and as 1.25 by Yahoo! Finance.
The CAPM estimate of the cost of equity capital for IBM is significantly different depending on what source is used for the company’s beta and what value is used for the market risk premium. Using a market risk premium of 5%, the beta of 0.97 provided by MarketWatch, and a risk-free rate of 3% results in a cost of capital of


If, instead, a market risk premium of 8% and the beta of 1.25 provided by Yahoo! Finance are used, the cost of capital is estimated to be


CONCEPTS IN PRACTICE
Estimating the Equity Cost of Capital
Although the calculation of the cost of capital using the CAPM equation is simple and straightforward, there is not one definitive equity cost of capital for a company that all financial managers will agree on. Consider the eight companies spotlighted in Table 17.3.
Four estimates of the equity cost of capital are calculated for each firm. The first two estimates are based on the beta provided by MarketWatch for each of the companies. A risk-free rate of 3% is assumed. Market risk premiums of both 5% and of 8% are considered. A market risk premium of 5% would suggest that long- run investors who hold a well-diversified portfolio, such as one with all of the stocks in the S&P 500, will average a return 5 percentage points higher than the risk-free rate, or 8%. If you assume instead that the average long-run return on the S&P 500 is 11%, then people who purchase a portfolio of those stocks are rewarded by earning 8 percentage points more than the 3% they would earn investing in the risk-free security.
Beta MRP = 5% MRP = 8% Beta MRP = 5% MRP = 8%
Yahoo! Finance
MarketWatch
Industry
Company
The last two estimates of the cost of equity capital for each company also use the same risk-free rate of 3% and the possible market risk premiums of 5% and 8%. The only difference is that the beta provided by Yahoo! Finance is used in the calculation.
|
Food retail |
0.31 |
4.55% |
5.48% |
0.66 |
6.30% |
8.28% |
|
|
Nonalcoholic beverages |
0.69 |
6.45% |
8.52% |
0.62 |
6.10% |
7.96% |
|
|
Telecommunications |
0.74 |
6.70% |
8.92% |
0.74 |
6.70% |
8.92% |
|
|
Food products |
0.82 |
7.10% |
9.56% |
1.14 |
8.70% |
12.12% |
|
|
Software |
1.19 |
8.95% |
12.52% |
0.79 |
6.95% |
9.32% |
|
|
Tires |
1.24 |
9.20% |
12.92% |
2.26 |
14.30% |
21.08% |
|
|
Passenger airlines |
1.34 |
9.70% |
13.72% |
1.93 |
12.65% |
18.44% |
|
|
Residential construction |
1.42 |
10.10% |
14.36% |
1.83 |
12.15% |
17.64% |
|
Table 17.3 Estimates of Equity Cost of Capital for Eight Companies (source: Yahoo! Finance; MarketWatch)
The range of the equity cost of capital estimates for each of the firms is significant. Consider, for example, Goodyear Tire and Rubber. According to MarketWatch, the beta for the company is 1.24, resulting in an estimated cost of equity capital between 9.20% and 12.92%. The beta provided by Yahoo! Finance is much higher, at 2.26. Using this higher beta results in an estimated equity cost of capital for Goodyear Tire and Rubber between 14.30% and 21.08%. This leaves the financial managers of Goodyear Tire and Rubber with an estimate of the equity cost of capital between 9.20% and 21.08%, using a range of reasonable assumptions.
What is a financial manager to do when one estimate is more than twice as large as another estimate? A financial manager who believes the equity cost of capital is close to 9% is likely to make very different choices from one who believes the cost is closer to 21%. This is why it is important for a financial manager to have a broad understanding of the operations of a particular company. First, the manager must know the historical background from which these numbers were derived. It is not enough for the manager to know that beta is estimated as 1.24 or 2.26; the manager must be able to determine why the estimates are so different. Second, the manager must be familiar enough with the company and the economic environment to draw a conclusion about what set of assumptions will most likely be reasonable going forward. While these numbers are based on historical data, the financial manager’s main concern is what the numbers will be going forward.
It is evident that estimating the equity cost of capital is not a simple task for companies. Although we do see a wide range of estimates in the table, some general principles emerge. First, the average company has a beta of 1. With a risk-free rate of 3% and a market risk premium in the range of 5% to 8%, the cost of equity capital will fall within a range of 8% to 11% for the average company. Companies that have a beta less than 1 will have an equity cost of capital that falls below this range, and companies that have a beta greater than 1 will have an equity cost of capital that rises above this range.
Recall that a company’s beta is heavily influenced by the type of industry. Grocery stores and providers of food products, for example, tend to have betas less than 1. During recessionary times, people still eat, but during expansionary times, people do not significantly increase their spending on these products. Thus, companies such as Kroger, Coca-Cola, and Kraft Heinz will tend to have low betas and a range of equity cost of capital below 8% to 11%.
The sales of companies in other industries tend to be much more volatile. During expansionary periods, people fly to vacation destinations and purchase new homes. During recessionary periods, families cut back on these discretionary expenditures. Thus, companies such as American Airlines and KB Homes will have higher betas and ranges of equity cost of capital that exceed the 8% to 11% average. The higher equity cost of capital is needed to incentivize investors to invest in these companies with riskier cash flows rather than in lower-risk companies.
The CAPM estimate depends on assumptions made, but issues also exist with the constant dividend growth model. First, the constant dividend growth model can be used only for companies that pay dividends. Second, the model assumes that the dividends will grow at a constant rate in the future, an assumption that is not always reasonable. It also assumes that the financial manager accurately forecasts the growth rate of dividends; any error in this forecast results in an error in estimating the cost of equity capital.
Given the differences in assumptions made when using the constant dividend growth model and the CAPM to estimate the equity cost of capital, it is not surprising that the numbers from the two models differ. When estimating the cost of equity capital for a particular firm, financial managers must examine the assumptions made for both approaches and decide which set of assumptions is more realistic for that particular company.
Net Debt
Many practitioners use net debt rather than total debt when calculating the weights for WACC. Net debt is the amount of debt that would remain if a company used all of its liquid assets to pay off as much debt as possible. Net debt is calculated as the firm’s total debt, both short-term and long-term, minus the firm’s cash and cash equivalents. Cash equivalents are current assets that can quickly and easily be converted into cash, such as Treasury bills, commercial paper, and marketable securities.
Consider, for example, Apple, which had $112.436 billion in total debt in 2020. The company also had $38.016 billion in cash and cash equivalents. This meant that the net debt for Apple was only $74.420 billion. If Apple used all of its cash and cash equivalents to pay debt, it would be left with $74.420 billion in debt.2
Cash and cash equivalents can be viewed as negative debt. For firms with relatively low levels of cash, this adjustment will not have a large impact on the overall WACC estimate. However, the adjustment can be important for firms that hold substantial cash reserves.
17.4
Capital Structure Choices
By the end of this section, you will be able to:
- Distinguish between a levered and an unlevered firm.
- Explain why the choice of capital structure does not impact the value of a firm in perfect financial markets.
- Calculate the interest tax shield.
- Explain how the interest tax shield encourages the use of leverage.
So far, we have taken the company’s capital structure as given. Each firm’s capital structure, however, is a result of intentional decisions made by the financial managers of the company. We now turn our attention to the issues that financial managers consider when making these decisions.
The Unlevered Firm
Let’s begin our discussion of capital structure choices by exploring the financing decisions you would face if you were to start a T-shirt business. Suppose that your hometown will host an international cycling competition. The competition itself will last for a month; cyclists will arrive early to train in the local climate. News coverage will be significant, meaning a lot of media personnel will be visiting your area. In addition to fans attending the event, it is expected that tourism will increase over the next year as recreational cyclists will want to ride the route of the professional race. You decide to operate a business for one year that will sell T- shirts highlighting this event.
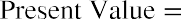
You will need to make an up-front investment of $40,000 to start the business. You estimate that you will generate a cash flow of $52,000, after you cover all of your operating costs, at the end of next year. You know that these profits are risky; you think a 10% risk premium is appropriate for the level of riskiness of the business. If the risk-free rate is 4%, this means that the appropriate discount rate for you to use is 14%. The value of this business opportunity is


This looks as if it will be a profitable business that should be undertaken. However, you do not have the
$40,000 for the up-front investment and will need to raise it.
First, consider raising money solely by selling ownership shares to your family and friends. How much would those shares be worth? The value of the stock would be equal to the present value of the expected future cash flows. The potential stockholders would expect to receive $45,614 in one year. If they agree with you that the riskiness of this T-shirt business warrants a discount rate of 14%, then they will value the stock at
- “Historical Data.” Apple Inc. (AAPL). Yahoo! Finance, accessed October 29, 2021. https://finance.yahoo.com/quote/AAPL/history/
If you sell all of the equity in the company for $45,614 and purchase the equipment necessary for the project for $40,000, you have $5,614 to keep as the entrepreneur who created the business.
This business would be financed 100% by equity. The lack of any debt in the capital structure means the firm would have no financial leverage. The equity in a firm that has no financial leverage is called unlevered equity.
The Levered Firm
Next, consider borrowing some of the money that you will need to start this T-shirt business. Although the cash flows from the business are uncertain, suppose you are certain that the business will generate at least
$18,000. (Perhaps you have a guaranteed order from the cycling competition sponsors.) If you borrowed


$17,000 at the risk-free interest rate of 4%, you would oweto the lenders at the end of the year. Because you are certain that you will generate at least $18,000 in cash, which is greater than
$17,680, you can borrow the $17,000 without any risk of defaulting.

The $17,000 will not be enough to pay for all the start-up costs. You will also need to raise some capital by selling equity. Because your firm will have some debt, or financial leverage, the equity that you raise will be known as levered equity. The equity holders expect the firm to generate $52,000 in cash flows. Debt holders must be paid before equity holders, so this will leave 
 for the shareholders.
The expected future cash flows generated by the business are determined by the productivity of its assets, not the manner in which those assets are financed. It is the present value of these expected future cash flows that determines the firm’s value. Thus, the firm’s value in perfect capital markets will not change as a result of the company taking on leverage.
LINK TO LEARNINGMM Proposition INobel laureates Franco Modigliani and Merton Miller wrote influential papers exploring capital structure and the cost of a firm’s capital. They began by considering what would occur in a perfectly competitive market. One of the assumptions of this perfect capital market is that there are no taxes. The idea that the market value of the unlevered and levered firm is the same in perfect capital markets is known in the field of finance as MM Proposition I.Visit Milken Institute’s 5-Minute Finance site to explore more about Modigliani and Miller’s contributions (https://openstax.org/r/Modigliani) to the understanding of capital structure.
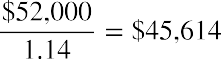
The value of your T-shirt business remains at $45,614. You can calculate the value of the levered equity as


Now, shareholders are willing to pay $28,614 for ownership in this company. They expect to get $34,320 in one year in return for purchasing this equity. What discount rate does this imply?


Notice that the expected return to shareholders has risen from 14% for the unlevered firm to 19.94% for the levered firm. Recall that the expected return to shareholders equals the risk-free rate plus a risk premium. The risk-free rate has remained 4%. With leverage, the risk premium rises from 10% to 15.94%.
Why does this risk premium increase? Recall that debt holders are paid before equity holders. Equity holders are residual claimants; they will only receive payment if there is money left over after the debt holders are fully paid. The business is risky. You are certain that the company will have cash flow of at least $18,000 at the end of the year and that $17,680 will be paid to the debt holders. Therefore, if the company performs poorly (perhaps bad weather results in the cancellation of much of the cycling competition) and the cash flows fall way below what you are expecting, there may be only several hundred dollars left for the shareholders.
When the firm was unlevered, if the cash flow at the end of the year was only $18,000, the shareholders would receive $18,000. When leverage is used, the same cash flow would result in shareholders receiving only $320. The risk to the shareholders increases as leverage is used; thus, the risk premium that shareholders require also increases as leverage is used.
Leverage and the WACC
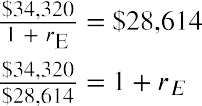
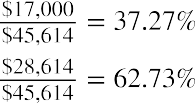 What happens to the WACC as leverage is used? To figure this out, we must calculate the weights of debt and equity in the capital structure:


In perfect capital markets, an assumption we are making for now, there are no taxes. Because we are using only debt and common stock, the weight of preferred stock is zero, and our WACC can be calculated as


Notice that the use of leverage does not change the WACC. When only equity was used to finance the business, stockholders required a 14% expected return to encourage them to let the firm use their capital. When leverage was used, the debt holders only required a 4% return. However, the existence of debt holders, who stand in front of shareholders in the order of claimants, puts shareholders in a riskier position. There is a greater chance that the shareholders will not receive payment from this uncertain business. Thus, the shareholders require a higher rate of return to let the leveraged firm use their capital.
The cost-savings benefits of using lower-cost debt in your company’s capital structure are exactly offset by the higher return that shareholders require when leverage is used. Mathematically, the increase in the cost of equity when leverage is used will be proportional to the debt–equity ratio. Financial managers refer to this outcome as MM Proposition II. The relationship is expressed by the formula


where ru is the required return to equity holders of the unlevered firm.
Table 17.4 shows how the cost of equity increases as the weight of debt in the capital structure increases. As the company uses more debt, the risk to equity holders increases. Because equity holders risk that there will be no residual money after bondholders are paid, the equity holders require a higher rate of return to invest in the company as its use of leverage increases. Although debt holders face less risk than equity holders, the risk that they face increases as the amount of debt the company takes on increases. Once the company’s debt exceeds its guaranteed cash flow, which is $18,000 in our example, debt holders face some risk that the company will not be able to pay them. At that point, the cost of debt rises above the risk-free rate. As the
weight of debt approaches 100%, the cost of debt capital approaches the cost of equity of the unlevered firm. In other words, if you financed the T-shirt business solely through the use of debt, the debt holders would require a 14% return because they would be bearing the entire risk of the business and would demand to be rewarded for doing so.
As the leverage of the firm increases, both the cost of debt capital and the cost of equity capital increase. However, as the firm’s leverage increases, it is using proportionately more of the relatively cheaper source of capital—debt— and proportionately less of the relatively more expensive source of capital—equity. Thus, the WACC remains constant as leverage increases, despite the rising cost of each component.
Table 17.4 Alternative Capital Structures for Your T-Shirt Business
The Impact of Taxes
In perfect capital markets, the choice of capital structure will not impact the value of the firm or the cost of the firm’s financing. In the real world, however, capital markets are not perfect. One of the important market imperfections is the presence of corporate taxes. Because the choice of capital structure can impact the taxes that a company pays, in the real world, capital structure can impact the cost of capital and the firm’s value.
Assume that your T-shirt business venture will result in earnings before interest and taxes (EBIT) of $52,000 next year and that the corporate tax rate is 28%. If your company is unlevered, it has no interest expense, and its net income will be $37,440, as shown in Table 17.5.
|
|
$52,000.00 |
|
|
Interest Expense |
0.00 |
280.00 |
|
Income before Taxes |
52,000.00 |
51,720.00 |
|
Taxes (28%) |
14,560.00 |
14,481.60 |
|
Net Income |
$37,440.00 |
$37,238.40 |
Table 17.5 Net Income and Leverage
If your company uses leverage, raising $7,000 of financing by issuing debt with a 4% interest rate, it will have an interest expense of $280. This lowers its taxable income to $51,720 and its taxes to $14,481.60. Because interest is a tax-deductible expense, using leverage lowers the company’s taxes.
Table 17.6 shows that the company’s net income is lower with leverage than it would be without leverage. In other words, debt obligations will reduce the value of the equity. However, less equity is needed because some of the firm is financed through debt. The important consideration is how the use of leverage changes the total
amount of dollars available to all investors. Table 17.6 shows this impact.
|
|
$0.00 |
$280.00 |
|
Amount Available to Stockholders |
37,440.00 |
37,238.40 |
|
Total Available for All Investors |
$37,440.00 |
$37,518.40 |
|
Table 17.6 Total Dollars Available to Investors |
|
|
Using leverage allows the firm to generate $37,518.40 to pay its investors, compared to only $37,440 that is available if the firm is unlevered. Where does the extra $78.40 to pay investors come from? It comes from the reduction in taxes that the firm pays due to leverage. If the company uses no debt, it pays $14,560 in taxes. The levered firm pays only $14,481.60 in taxes, a savings of $78.40.


 The $280 that the levered company pays in interest is shielded from the corporate tax, resulting in tax savings of. The additional amount available to investors because of the tax deductibility of interest payments is known as the interest tax shield. The interest tax shield is calculated as


When interest is a tax-deductible expense, the total value of the levered firm will exceed the value of the unlevered firm by the amount of this interest tax shield. The tax-advantage status of debt financing impacts the WACC. The WACC with taxes is calculated as


This formula can be written as


Thus, the WACC with taxes is lower than the pretax WACC because of the interest tax shield. The more debt the firm has, the greater the dollar amount of this interest tax shield. The presence of the interest tax shield encourages firms to use debt financing in their capital structures.
17.5
Optimal Capital Structure
By the end of this section, you will be able to:
- Explain how increased use of leverage increases the possibility of financial distress.
- Explain how the possibility of financial distress impacts the cost of capital.
- Discuss the trade-offs a firm faces as it increases its leverage.
- Explain the concept of an optimal capital structure.
Debt and Financial Distress
The more debt a company uses in its capital structure, the larger the dollar value of the interest tax shield. Why, then, do we not see firms using a capital structure composed 100% of debt to maximize this interest tax shield?
The answer to this question lies in the fact that as a company increases its debt, there is a greater chance that the firm will be unable to make its required interest payments on the debt. If the firm has difficulty meeting its
debt obligations, it is said to be in financial distress.
A firm in financial distress incurs both direct and indirect costs. The direct costs of financial distress include fees paid to lawyers, consultants, appraisers, and auctioneers. The indirect costs include loss of customers and suppliers.
Trade-Off Theory
Trade-off theory weighs the advantages and disadvantages of using debt in the capital structure. The advantage of using debt is the interest tax shield. The disadvantage of using debt is that it increases the risk of financial distress and the costs associated with financial distress.
A company has an incentive to increase leverage to exploit the interest tax shield. However, too much debt will make it more likely that the company will default and incur financial distress costs. Calculating the precise balance between these two is difficult if not impossible.
For companies with a low level of debt, the risk of default is low, and the main impact of an increase in leverage will be an increase in the interest tax shield. At some point, however, the tax savings that result from increasing the amount of debt in the capital structure will be just offset by the increased probability of incurring the costs of financial distress. For firms that have higher costs of financing distress, this point will be reached sooner. Thus, firms that face higher costs of financial distress have a lower optimal level of leverage than firms that face lower costs of financial distress.
LINK TO LEARNINGNetflixNetflix has experienced phenomenal growth in the past 25 years. Starting as a DVD rental company, Netflix quickly shifted its model to content streaming. In recent years, the company has become a major producer of content, and it is currently the largest media/entertainment company by market capitalization. It is expensive for Netflix to fund the production of this content. Netflix has funded much of its content through selling debt.You can view the company’s explanation of this capital structure choice by looking at the answers the company provides to common investor questions (https://openstax.org/r/the-company-provides). You can also find the company’s financial statements on its website and see how the level of debt on Netflix’s balance sheet has increased over the past few years.
Figure 17.4 demonstrates how the value of a levered firm varies with the level of debt financing used. Vu is the value of the unlevered firm, or the firm with no debt. As the firm begins to add debt to its capital structure, the value of the firm increases due to the interest tax shield. The more debt the company takes on, the greater the tax benefit it receives, up until the point at which the company’s interest expense exceeds its earnings before interest and taxes (EBIT). Once the interest expense equals EBIT, the firm will have no taxable income. There is no tax benefit from paying more interest after that point.
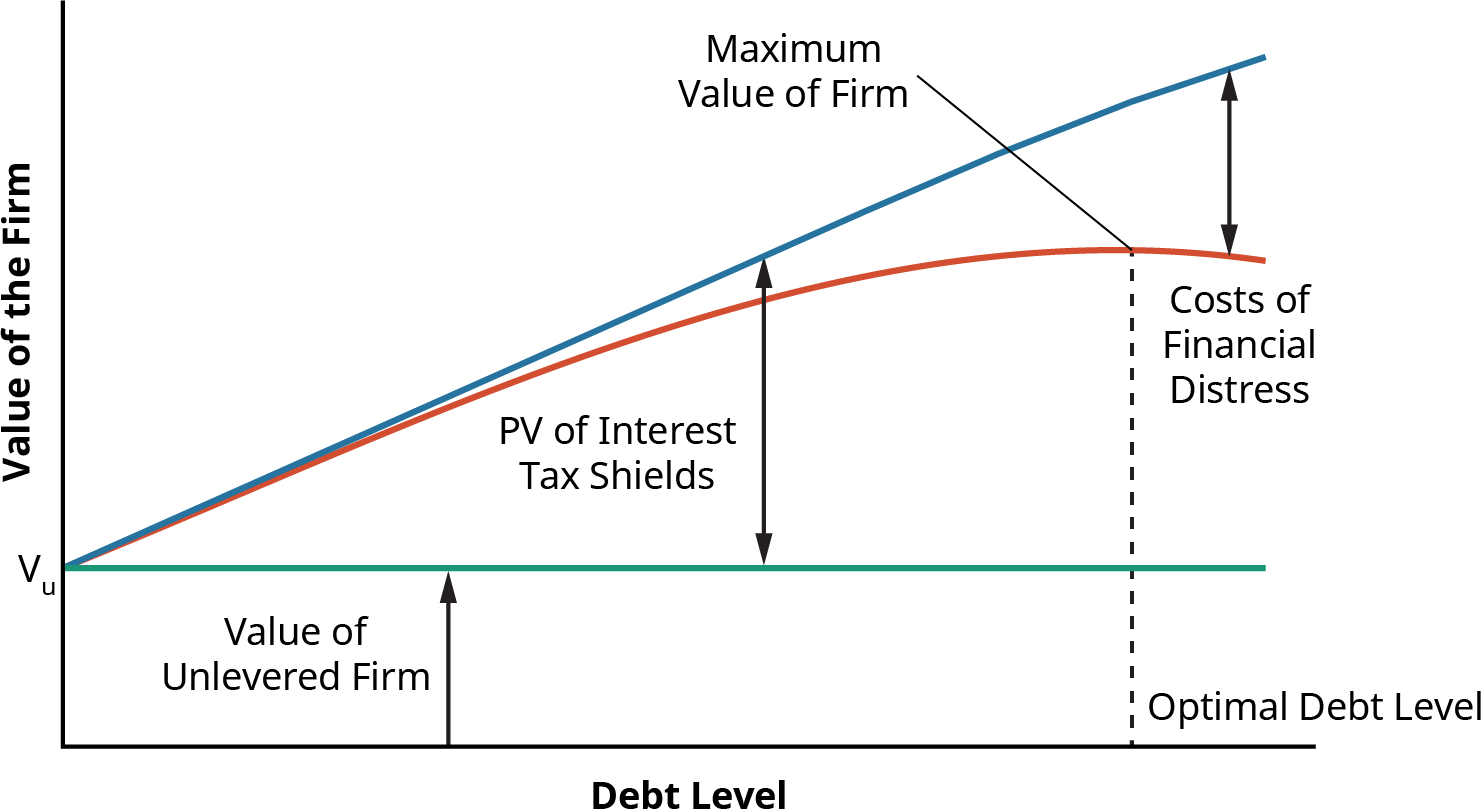
Figure 17.4 Maximum Value of a Levered Firm
As the firm increases debt and increases the value of the tax benefit of debt, it also increases the probability of facing financial distress. The magnitude of the costs of financial distress increases as the debt level of the company rises. To some degree, these costs offset the benefit of the interest tax shield.
The optimal debt level occurs at the point at which the value of the firm is maximized. A company will use this optimal debt level to determine what the weight of debt should be in its target capital structure. The optimal capital structure is the target. Recall that the market values of a company’s debt and equity are used to determine the costs of capital and the weights in the capital structure. Because market values change daily due to economic conditions, slight variations will occur in the calculations from one day to the next. It is neither practical nor desirable for a firm to recalculate its optimal capital structure each day.
Also, a company will not want to make adjustments for minor differences between its actual capital structure and its optimal capital structure. For example, if a company has determined that its optimal capital structure is 22.5% debt and 77.5% equity but finds that its current capital structure is 23.1% debt and 76.9% equity, it is close to its target. Reducing debt and increasing equity would require transaction costs that might be quite significant.
Table 17.7 shows the average WACC for some common industries. The calculations are based on corporate information at the end of December 2020. A risk-free rate of 3% and a market-risk premium of 5% are assumed in the calculations. You can see that the capital structure used by firms varies widely by industry. Companies in the online retail industry are financed almost entirely through equity capital; on average, less than 7% of the capital comes from debt for those companies. On the other hand, companies in the rubber and tires industry tend to use a heavy amount of debt in their capital structure. With a debt weight of 63.62%, almost two-thirds of the capital for these companies comes from debt.
Industry NameEquity Weight Debt Weight Beta Cost of Equity Tax RateAfter-TaxCost of DebtWACCRetail (online) Computers/peripherals Household productsDrugs (pharmaceutical)93.33%91.45%87.07%84.62%6.67% 1.168.55% 1.1812.93% 0.7315.38% 0.918.82%2.93%8.92%3.71%6.65%5.06%7.54%1.88%2.19% 8.38%1.88% 8.32%2.19% 6.07%2.19% 6.72%
Table 17.7 Capital Structure, Cost of Debt, Cost of Equity, and WACC for Selected Industries (data source: Aswath Damodaran Online)
|
Cost of Debt |
|||||||
|
Retail (general) |
82.41% |
17.59% |
0.90 |
7.49% |
12.48% |
1.88% |
6.51% |
|
Beverages (soft) |
82.24% |
17.76% |
0.79 |
6.96% |
3.32% |
2.19% |
6.11% |
|
Tobacco |
76.74% |
23.26% |
0.72 |
6.61% |
8.69% |
1.88% |
5.51% |
|
Homebuilding |
75.34% |
24.66% |
1.46 |
10.29% |
15.91% |
2.19% |
8.30% |
|
Food processing |
75.18% |
24.82% |
0.64 |
6.18% |
8.56% |
2.19% |
5.19% |
|
Restaurants/dining |
74.79% |
25.21% |
1.34 |
9.72% |
3.19% |
2.19% |
7.82% |
|
Apparel |
71.74% |
28.26% |
1.10 |
8.49% |
4.75% |
2.19% |
6.71% |
|
Farming/agriculture |
68.94% |
31.06% |
0.87 |
7.37% |
6.45% |
1.88% |
5.67% |
|
Packaging & containers |
64.47% |
35.53% |
0.92 |
7.61% |
15.67% |
1.88% |
5.57% |
|
Food wholesalers |
64.10% |
35.90% |
1.03 |
8.17% |
0.52% |
2.19% |
6.02% |
|
Hotels/gaming |
63.60% |
36.40% |
1.56 |
10.82% |
2.02% |
2.19% |
7.68% |
|
Telecom. services |
54.60% |
45.40% |
0.66 |
6.30% |
3.93% |
1.40% |
4.07% |
|
Retail (grocery and food) |
51.46% |
48.54% |
0.24 |
4.21% |
13.52% |
2.19% |
3.23% |
|
Air transport |
38.26% |
61.74% |
1.61 |
11.04% |
6.00% |
2.19% |
5.58% |
|
Rubber & tires |
36.38% |
63.62% |
1.09 |
8.47% |
5.30% |
1.88% |
4.28% |
Table 17.7 Capital Structure, Cost of Debt, Cost of Equity, and WACC for Selected Industries (data source: Aswath Damodaran Online)
Industries that have high betas, such as hotels/gaming and air transport, have high equity costs of capital. More recession-proof industries, such as food processing and household products, have low betas and low equity costs of capital. The WACC for each industry ends up being influenced by the weights of equity and debt the company chooses, the riskiness of the industry, and the tax rates faced by companies in the industry.
17.6
Alternative Sources of Funds
By the end of this section, you will be able to:
- Calculate the required return to preferred shareholders.
- Calculate the WACC of a firm that issues preferred shares.
- Discuss how issuing new equity impacts the cost of equity capital.
- Explain the functionality of convertible debt.
A company can finance its assets in two ways: through debt financing and through equity financing. Thus far, we have treated these sources as two broad categories, each with a single cost of capital. In reality, a company may have different types of debt or equity, each with its own cost of capital. The same principle would apply: the WACC of the firm would be calculated using the weights of each of these types multiplied by the cost of that particular type of debt or equity capital.
Preferred Shares
Although our calculations of WACC thus far have assumed that companies finance their assets only through debt and common equity, we saw at the beginning of the chapter that the basic WACC formula is


In addition to common stock, a company can raise equity capital by issuing preferred stock. Owners of
preferred stock are promised a fixed dividend, which must be paid before any dividends can be paid to common stockholders.
In the order of claimants, preferred shareholders stand in line between bondholders and common shareholders. Bondholders are paid interest before preferred shareholders are paid annual dividends. Preferred shareholders are paid annual dividends before common shareholders are paid dividends. Should the company face bankruptcy, the same priority of claimants is followed in settling claims—first bondholders, then preferred stockholders, with common stockholders standing at the end of the line.
Preferred stock shares some characteristics with debt financing. It has a promised cash flow to its holders. Unlike common equity, the dividend on preferred stock is fixed and known. Also, there are consequences if those preferred dividends are not paid. Common shareholders cannot receive any dividends until preferred dividends are paid, and in some cases, preferred shareholders receive voting rights until they are paid the dividends that are due. However, preferred shareholders cannot force the company into bankruptcy as debt holders can. For tax and legal purposes, preferred stock is treated as equity.
The cost of the preferred equity capital is calculated using the formula


Suppose that Greene Building Company has issued preferred stock that pays a dividend of $2.00 each year. If this preferred stock is selling for $21.80 per share, then the company’s cost of preferred stock is


THINK IT THROUGH
Calculating Common Equity Financing
Greene Building Company uses 40% debt, 15% preferred stock, and 45% common stock in its capital structure. The yield to maturity on the company’s bonds is 7.2%. The cost of preferred equity is 9.17%. In the most recent year, Greene paid a dividend of $3.15 to its common shareholders. This dividend has been growing at a rate of 3.0% per year, which is expected to continue in the future. The company’s common stock is trading for $32.25 per share. Greene pays a corporate tax rate of 21%. Estimate the WACC for Greene.
Solution:
The cost of Greene’s common equity financing must be calculated. This can be done using the constant dividend growth model:
The weights and the costs for each component of capital are placed in the WACC formula:
The WACC for Greene Building Company is estimated to be 9.47%. Note that debt financing is the cheapest cost of capital for Greene. The reason for this is twofold. First, because debt holders face the least amount of risk because they are paid first in the order of claimants, they require a lower return. Second, because interest payments are tax-deductible, the interest tax shield lowers the effective cost of debt to the
company. Preferred shareholders will require a higher rate of return than debt holders, 9.17%, because they are later in the order of claimants. Common shareholders are the residual claimants, standing at the end of the line to receive payment. After all other claimants are paid, any remaining money belongs to the shareholders. If this residual amount is small, the common shareholders receive a small payment. If there is nothing left after all other claimants have been paid, common shareholders receive nothing. Thus, common shareholders have the greatest amount of risk and require the highest rate of return.Also, note that the weights for debt, preferred stock, and common stock in the capital structure sum to 100%. The company must finance 100% of its assets.
Issuing New Common Stock
An existing firm can acquire equity capital to expand its assets in two ways: the retention of earnings or the sale of new shares of stock. Thus far in the chapter, the cost of equity capital calculations have assumed that the earnings were being retained for equity capital financing.
The net income that is left after all expenses are paid is the residual income that belongs to the shareholders. Instead of receiving a fixed payment for letting the firm use their capital (like bondholders who receive fixed interest payments), the reward to shareholders for letting the company use their capital varies from year to year. In a good year, net income and the reward to shareholders is high. In a poor year, net income is low or perhaps even negative.
The net income can either be paid immediately and directly to shareholders in the form of dividends or be retained within the company to fund growth. Shareholders are willing to allow the company to retain these earnings because they expect that the money will be used to fund profitable projects, leading to an even larger reward for shareholders in future years.
Although managers do not need to actively solicit the funds that are retained to fund the business, managers cannot view these funds as costless. The shareholders will require a return on those funds to entice them to allow the company to delay paying the dollars to them immediately in terms of a dividend.
Suppose a company has $1 million in net income one year. If it pays $250,000 in dividends and retains
$750,000, then it can finance $750,000 more in assets. If the company has a capital structure of 25% debt and 75% equity and wants to maintain that capital structure, it must increase its debt by $250,000 to balance the increase in equity. Thus, the company would be increasing its total financing by $1 million. Of that financing, 25% would be debt financing, and 75% would be equity financing.
To increase its assets by more than $1 million, the company would need to decide to either change its capital structure or issue new stock. Consider the firm represented by the market-value balance sheet in Figure 17.5. The firm has $900 million in assets. These assets are financed by $225 million in debt capital and $675 million in equity capital, resulting in a capital structure of 25% debt and 75% equity.
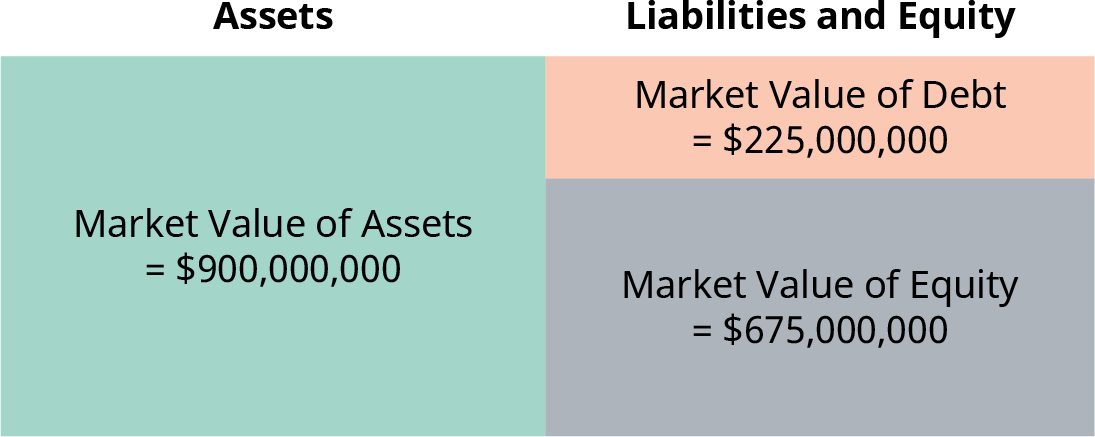
Figure 17.5 Market-Value Balance Sheet for a Company with $900 Million in Assets and a Capital Structure of 25% Debt and 75% Equity
The retained earnings of $750,000 cause the equity on the balance sheet to increase to $675.75 million. The
company could sell $250,000 in bonds, increasing its debt to $225.25 million. Figure 17.6 shows the impact on the balance sheet. The company has increased its financing by $1,000,000 and can expand assets by
$1,000,000. The capital structure remains 25% debt and 75% equity.
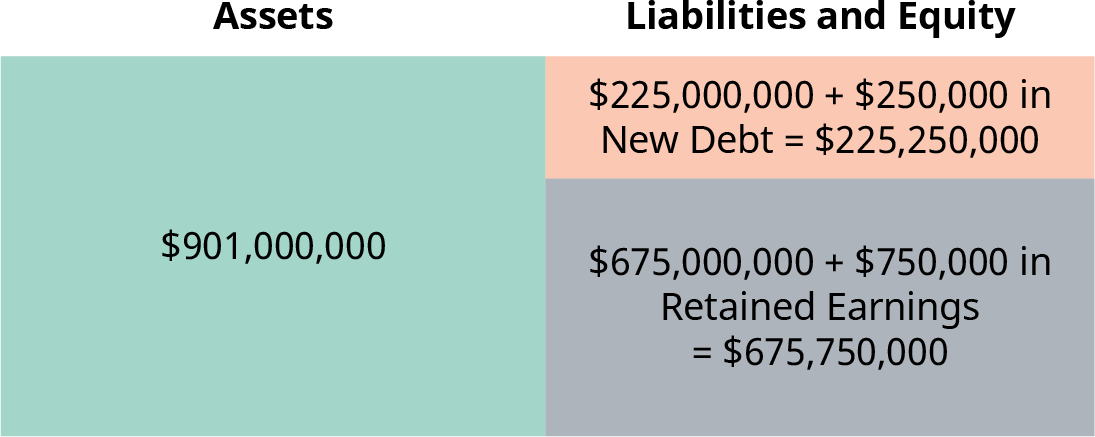
Figure 17.6 Balance Sheet with $1 Million Growth Financed through Retained Earnings and New Debt
What if the economy is in an expansionary period and this company thinks it has the opportunity to grow at a rate of 5%? The company knows that it will need more assets to be able to grow. If it needs 5% more assets, its assets will need to increase to $945 million. To increase the left-hand side of its balance sheet, the company will also need to increase the right-hand side of the balance sheet.
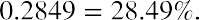
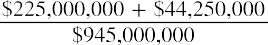 Where does the company get the $45 million in capital? With $750,000 in retained earnings, the company can increase its equity to $675.75 million, but if the remainder of $44.25 million was financed through debt, the company’s capital structure would change. Its weight of debt would increase to
If the company has determined that its optimal capital structure is 25% debt and 75% equity, financing the majority of the growth through debt would cause it to stray from these levels. Funding the growth while keeping the capital structure the same would require the firm to issue new shares. Figure 17.7 shows how the firm would need to finance $45 million in growth while maintaining its desirable capital structure. The firm would need to increase equity capital to $708.75 million; retained earnings could provide $750,000, but $33 million of new equity would need to be sold.
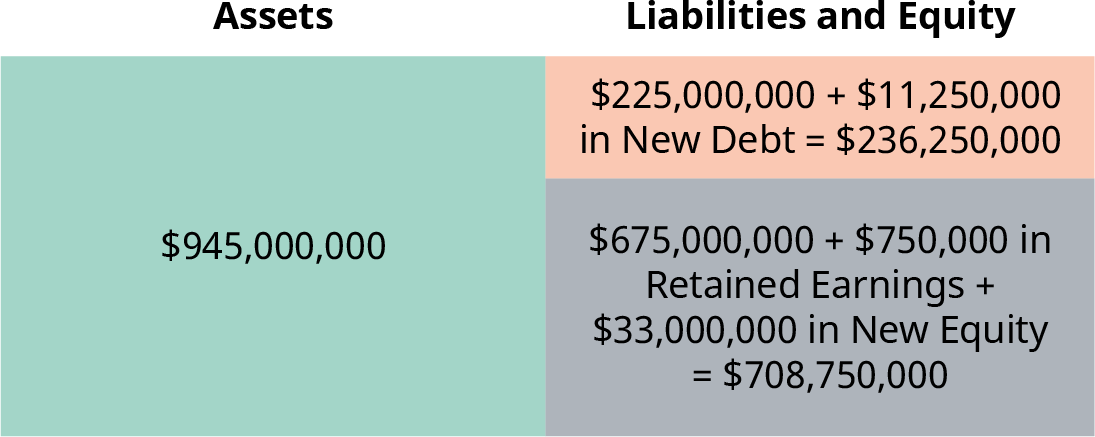
Figure 17.7 Balance Sheet with $45,000,000 in Financing Coming from Debt, Retained Earnings, and New Stock
Investors who are providing common equity financing require a return to entice them to let the company use their money. If this company has paid $0.50 per share in dividends to shareholders and this dividend is expected to increase by 3% each year, we can use the constant dividend growth model to estimate how much common shareholders require. If the stock is trading for $8.00 per share, the cost of common equity financing is estimated as


If, however, the firm must issue more equity, its cost of equity for those additional shares will be higher than 9.44%. Even if shareholders are willing to pay $8.00 per share for the stock, the firm will incur flotation costs; this means the firm will not receive the entire $8.00 to use to finance new assets and generate a profit for shareholders. Flotation costs include the costs of filing with the Securities and Exchange Commission (SEC) as
well as the fees paid to investment bankers to place the new shares.


 When new equity must be issued to finance the company, the flotation costs must be subtracted from the price of the stock to determine the net proceeds the firm will receive. The cost of this new equity capital is calculated as


where F represents the flotation costs of the new stock issue. If, in this example, the flotation cost is $0.25 per share, then the cost of raising new equity capital is


Issuing new common equity is the most expensive form of raising capital. Equity capital is already expensive because the common shareholders are the residual claimants who will only be paid if all other claimants are paid. Because of this risk, they require a higher rate of return than providers of capital who have precedence in the order of claimants. Flotation costs must be added to this equity cost when new shares are issued to grow the company.
THINK IT THROUGH
Cost of Issuing New Equity
You are a financial manager for American Motor Works (AMW). The target capital structure for the company is 30% debt and 70% equity. You know that your company’s after-tax cost of debt is 4.6%. Your company paid a dividend of $3 per share last year, and it has a policy of increasing its dividend at a rate of 1.5% each year. AMW stock is currently trading for $27.50 per share. You estimate that the company’s retained earnings will be $10 million this year. If the company needs to issue new shares of stock, flotation costs are expected to be $0.75 per share.
Given this information, you are tasked with calculating the company’s WACC. You need to provide an estimate of WACC if retained earnings are used and an estimate if new equity must be issued.
Solution:
First, calculate the cost of equity capital for AMW using the constant dividend growth model:
Using 12.57% as the equity cost of capital and 4.6% as the after-tax cost of debt, the WACC is calculated as
The WACC for AMW when it is using retained earnings for equity financing is 10.18%. If the company has
$10 million in retained earnings this year, its equity will increase by $10 million. Given its target capital structure of 30% debt and 70% equity, AMW will be able to increase its overall financing by
by using its retained earnings and issuing new debt of $4,285,714.
If AMW wants to expand its assets by more than $14,285,714 during the next year, it will need to issue new stock or increase the weight of debt in its capital structure. The company will incur flotation costs of $0.65 per share to issue new stock. The cost of new equity capital will be
 With this more expensive newly issued equity capital, AMW’s WACC will becomeIf AMW wants to take on a large project that requires investment in more than $14,285,714 worth of assets, such as building a new production facility, the company will need to issue more equity and will face a higher WACC than when using retained earnings as its equity financing.
Convertible Debt
Some companies issue convertible bonds. These corporate bonds have a provision that gives the bondholder the option of converting each bond held into a fixed number of shares of common stock. The number of common shares the bondholder would receive for each bond is known as the conversion ratio.

Suppose that you own a convertible bond issued by Sheridan Sodas with a face value of $1,000 and a conversion ratio of 20 shares that matures today. If you convert the bond today, you will receive 20 shares of Sheridan common stock. If you do not convert, you will receive $1,000. If you convert, you are basically paying
 $1,000 for 20 shares of Sheridan stock. The conversion price isIf Sheridan is trading for more
than $50 per share, you would want to convert. If Sheridan is trading for less than $50 per share, you would not want to convert; you would prefer the $1,000. In other words, you will choose to convert whenever the stock price exceeds the conversion price at maturity.
A convertible bond gives the holder an option; the bondholder is able to choose between the face value cash or receiving shares of stock. Options always have a positive value to holders. It is always preferable to be able to choose $1,000 or shares of stock than to simply be given $1,000. There is a possibility that the shares of stock will be more valuable, and there is no way the choice can put you in a worse position.
Because holders of convertible bonds have the valuable option of conversion that holders of nonconvertible bonds do not have, convertible debt can be offered with a lower interest rate. It might seem as if the firm could lower its weighted average cost of capital by issuing convertible debt rather than nonconvertible debt. However, this is not the case. Remember that holders of convertible bonds choose whether they would prefer to convert the bond and become a stockholder or receive the face value of the bond at maturity.
If a bond has a face value of $1,000, the convertible bond holders will consider whether the stock they can convert to is worth more than $1,000. Only when the price of the stock has increased enough that the value of the stock received is more than $1,000 will the bondholders convert. However, this means that instead of paying $1,000, the firm is paying the bondholder in stock worth more than $1,000. In essence, the firm (and the current shareholders) would be selling an equity position in the company for less than the market price of that equity position. The lower interest rate compensates for the possibility that conversion will occur.
 Summary
The Concept of Capital Structure
Capital structure refers to how a company finances its assets. The two main sources of capital are debt financing and equity financing. A cost of capital exists because investors want a return equivalent to what they would receive on an investment with an equivalent risk to persuade them to let the company use their funds. The market values of debt and equity are used to calculate the weights of the components of the capital structure.
The Costs of Debt and Equity Capital
The yield to maturity (YTM) on a company’s outstanding bonds represents the return that debt holders are requiring to lend money to the company. Because interest expenses are tax-deductible, the cost of debt to the company is less than the YTM. The cost of equity capital is not directly observed, so financial managers must estimate this cost. Two common methods for estimating the cost of equity capital are the constant dividend growth model and the capital asset pricing model (CAPM).
Calculating the Weighted Average Cost of Capital
Calculate the weighted average cost of capital (WACC) using the formula


Remember that the WACC is an estimate; different methods of estimating the cost of equity capital can lead to different estimations of WACC.
Capital Structure Choices
An unlevered firm uses no debt in its capital structure. A levered firm uses both debt and equity in its capital structure. In perfect financial markets, the value of the firm will be the same regardless of the firm’s decision to use leverage. With the tax deductibility of interest expenses, however, the value of the firm can increase through the use of debt. As the level of debt increases, the value of the interest tax shield increases.
Optimal Capital Structure
A company wants to choose a capital structure that maximizes its value. Although increasing the level of financial leverage, or debt, in the capital structure increases the value of the interest tax shield, it also increases the probability of financial distress. As the weight of debt in the capital structure increases, the return that providers of both debt and equity capital require to entice them to provide money to the firm increases because their risk increases. Trade-off theory suggests that the value of a company that uses debt equals the value of the unlevered firm plus the value of the interest tax shield minus financial distress costs.
Alternative Sources of Funds
Preferred stock is a type of equity capital; the owners of preferred stock receive preferential treatment over common stockholders in the order of claimants. A fixed dividend is paid to preferred shareholders and must be paid before common shareholders receive dividends. Equity capital can be raised through either retaining earnings or selling new shares of stock. Significant flotation costs are associated with issuing new shares of stock, making it the most expensive source of financing. Convertible debt allows the debt holders to convert their debt into a fixed number of common shares instead of receiving the face value of the stock at maturity.
 Key Terms
after-tax cost of debt the net cost of interest on a company’s debt after taxes; the firm’s effective cost of debt
capital a company’s sources of financing
capital structure the percentages of a company’s assets that are financed by debt capital, preferred stock capital, and common stock capital
conversion price the face value of a convertible bond divided by its conversion ratio
conversion ratio the number of shares of common stock receivable for each convertible bond that is converted
convertible bonds bonds that can be converted into a fixed number of shares of common stock upon maturity
financial distress when a firm has trouble meeting debt obligations financial leverage the debt used in a company’s capital structure flotation costs costs involved in the issuing and placing of new securities
interest tax shield the reduction in taxes paid because interest payments on debt are a tax-deductible expense; calculated as the corporate tax rate multiplied by interest payments
levered equity equity in a firm that has debt outstanding
net debt a company’s total debt minus any cash or risk-free assets the company holds
preferred stock equity capital that has a fixed dividend; preferred shareholders fall in between debt holders and common stockholders in the order of claimants
trade-off theory a theory stating that the total value of a levered company is the value of the firm without leverage plus the value of the interest tax shield less financial distress costs
unlevered equity equity in a firm that has no debt outstanding
weighted average cost of capital (WACC) the average of a firm’s debt and equity costs of capital, weighted by the fractions of the firm’s value that correspond to debt and equity