Chapter 3 – Measuring the Size of the Economy: Gross Domestic Product
OpenStax
Learning Objectives
- Identify the components of GDP on the demand side
- Evaluate how gross domestic product (GDP) is measured
Macroeconomics is an empirical subject, so the first step toward understanding it is to measure the economy.
How large is the U.S. economy? The size of a nation’s overall economy is typically measured by its gross domestic product (GDP), which is the value of all final goods and services produced within a country in a given year. The measurement of GDP involves counting up the production of millions of different goods and services—smart phones, cars, music downloads, computers, steel, bananas, college educations, and all other new goods and services produced in the current year—and summing them into a total dollar value. This task is straightforward: take the quantity of everything produced, multiply it by the price at which each product sold, and add up the total. In 2014, the U.S. GDP totaled $17.4 trillion, the largest GDP in the world.
Each of the market transactions that enter into GDP must involve both a buyer and a seller. The GDP of an economy can be measured either by the total dollar value of what is purchased in the economy, or by the total dollar value of what is produced. There is even a third way, as we will explain later.
GDP Measured by Components of Demand
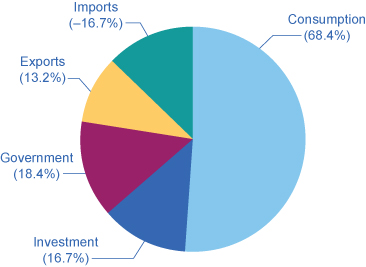
Who buys all of this production? This demand can be divided into four main parts: consumer spending (consumption), business spending (investment), government spending on goods and services, and spending on net exports. (See the following Clear It Up feature to understand what is meant by investment.) Table 1 shows how these four components added up to the GDP in 2014. Figure 2 (a) shows the levels of consumption, investment, and government purchases over time, expressed as a percentage of GDP, while Figure 2 (b) shows the levels of exports and imports as a percentage of GDP over time. A few patterns about each of these components are worth noticing. Table 1 shows the components of GDP from the demand side. Figure 1 provides a visual of the percentages.
| Components of GDP on the Demand Side (in trillions of dollars) | Percentage of Total | |
|---|---|---|
| Consumption | $11.9 | 68.4% |
| Investment | $2.9 | 16.7% |
| Government | $3.2 | 18.4% |
| Exports | $2.3 | 13.2% |
| Imports | –$2.9 | –16.7% |
| Total GDP | $17.4 | 100% |
| Table 1. Components of U.S. GDP in 2014: From the Demand Side. (Source: http://bea.gov/iTable/index_nipa.cfm) | ||
What is meant by the word “investment”?
What do economists mean by investment, or business spending? In calculating GDP, investment does not refer to the purchase of stocks and bonds or the trading of financial assets. It refers to the purchase of new capital goods, that is, new commercial real estate (such as buildings, factories, and stores) and equipment, residential housing construction, and inventories. Inventories that are produced this year are included in this year’s GDP—even if they have not yet sold. From the accountant’s perspective, it is as if the firm invested in its own inventories. Business investment in 2014 was almost $3 trillion, according to the Bureau of Economic Analysis.
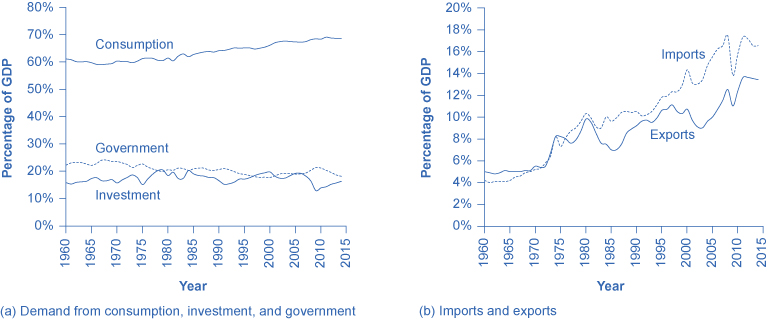
Consumption expenditure by households is the largest component of GDP, accounting for about two-thirds of the GDP in any year. This tells us that consumers’ spending decisions are a major driver of the economy. However, consumer spending is a gentle elephant: when viewed over time, it does not jump around too much.
How do statisticians measure GDP?
Government economists at the Bureau of Economic Analysis (BEA), within the U.S. Department of Commerce, piece together estimates of GDP from a variety of sources.
Once every five years, in the second and seventh year of each decade, the Bureau of the Census carries out a detailed census of businesses throughout the United States. In between, the Census Bureau carries out a monthly survey of retail sales. These figures are adjusted with foreign trade data to account for exports that are produced in the United States and sold abroad and for imports that are produced abroad and sold here. Once every ten years, the Census Bureau conducts a comprehensive survey of housing and residential finance. Together, these sources provide the main basis for figuring out what is produced for consumers.
For investment, the Census Bureau carries out a monthly survey of construction and an annual survey of expenditures on physical capital equipment.
For what is purchased by the federal government, the statisticians rely on the U.S. Department of the Treasury. An annual Census of Governments gathers information on state and local governments. Because a lot of government spending at all levels involves hiring people to provide services, a large portion of government spending is also tracked through payroll records collected by state governments and by the Social Security Administration.
With regard to foreign trade, the Census Bureau compiles a monthly record of all import and export documents. Additional surveys cover transportation and travel, and adjustment is made for financial services that are produced in the United States for foreign customers.
Many other sources contribute to the estimates of GDP. Information on energy comes from the U.S. Department of Transportation and Department of Energy. Information on healthcare is collected by the Agency for Health Care Research and Quality. Surveys of landlords find out about rental income. The Department of Agriculture collects statistics on farming.
All of these bits and pieces of information arrive in different forms, at different time intervals. The BEA melds them together to produce estimates of GDP on a quarterly basis (every three months). These numbers are then “annualized” by multiplying by four. As more information comes in, these estimates are updated and revised. The “advance” estimate of GDP for a certain quarter is released one month after a quarter. The “preliminary” estimate comes out one month after that. The “final” estimate is published one month later, but it is not actually final. In July, roughly updated estimates for the previous calendar year are released. Then, once every five years, after the results of the latest detailed five-year business census have been processed, the BEA revises all of the past estimates of GDP according to the newest methods and data, going all the way back to 1929.
Visit this website to read FAQs on the BEA site. You can even email your own questions!

When thinking about the demand for domestically produced goods in a global economy, it is important to count spending on exports—domestically produced goods that are sold abroad. By the same token, we must also subtract spending on imports—goods produced in other countries that are purchased by residents of this country. The net export component of GDP is equal to the dollar value of exports (X) minus the dollar value of imports (M), (X – M). The gap between exports and imports is called the trade balance. If a country’s exports are larger than its imports, then a country is said to have a trade surplus. In the United States, exports typically exceeded imports in the 1960s and 1970s, as shown in Figure 2 (b).
Since the early 1980s, imports have typically exceeded exports, and so the United States has experienced a trade deficit in most years. Indeed, the trade deficit grew quite large in the late 1990s and in the mid-2000s. Figure 2 (b) also shows that imports and exports have both risen substantially in recent decades, even after the declines during the Great Recession between 2008 and 2009. As noted before, if exports and imports are equal, foreign trade has no effect on total GDP. However, even if exports and imports are balanced overall, foreign trade might still have powerful effects on particular industries and workers by causing nations to shift workers and physical capital investment toward one industry rather than another.
Based on these four components of demand, GDP can be measured as:
Understanding how to measure GDP is important for analyzing connections in the macro economy and for thinking about macroeconomic policy tools.
| What is Counted in GDP | What is not included in GDP |
|---|---|
| Consumption | Intermediate goods |
| Business investment | Transfer payments and non-market activities |
| Government spending on goods and services | Used goods |
| Net exports | Illegal goods |
| Table 3. Counting GDP | |
Notice the items that are not counted into GDP, as outlined in above. The sales of used goods are not included because they were produced in a previous year and are part of that year’s GDP. The entire underground economy of services paid “under the table” and illegal sales should be counted, but is not, because it is impossible to track these sales. In a recent study by Friedrich Schneider of shadow economies, the underground economy in the United States was estimated to be 6.6% of GDP, or close to $2 trillion dollars in 2013 alone. Transfer payments, such as payment by the government to individuals, are not included, because they do not represent production. Also, production of some goods—such as home production as when you make your breakfast—is not counted because these goods are not sold in the marketplace.
Visit this website to read about the “New Underground Economy.”

Key Concepts and Summary
The size of a nation’s economy is commonly expressed as its gross domestic product (GDP), which measures the value of the output of all goods and services produced within the country in a year. GDP is measured by taking the quantities of all goods and services produced, multiplying them by their prices, and summing the total. Since GDP measures what is bought and sold in the economy, it can be measured either by the sum of what is purchased in the economy or what is produced.
Demand can be divided into consumption, investment, government, exports, and imports. What is produced in the economy can be divided into durable goods, nondurable goods, services, structures, and inventories. To avoid double counting, GDP counts only final output of goods and services, not the production of intermediate goods or the value of labor in the chain of production.
Self-Check Questions
- Country A has export sales of $20 billion, government purchases of $1,000 billion, business investment is $50 billion, imports are $40 billion, and consumption spending is $2,000 billion. What is the dollar value of GDP?
- Which of the following are included in GDP, and which are not?
- The cost of hospital stays
- The rise in life expectancy over time
- Child care provided by a licensed day care center
- Child care provided by a grandmother
- The sale of a used car
- The sale of a new car
- The greater variety of cheese available in supermarkets
- The iron that goes into the steel that goes into a refrigerator bought by a consumer.
References
U.S. Department of Commerce: Bureau of Economic Analysis. “National data: National Income and Product Accounts Tables.” http://bea.gov/iTable/iTable.cfm?ReqID=9&step=1.
U.S. Department of Commerce: United States Census Bureau. “Census of Governments: 2012 Census of Governments.” http://www.census.gov/govs/cog/.
United States Department of Transportation. “About DOT.” Last modified March 2, 2012. http://www.dot.gov/about.
U.S. Department of Energy. “Energy.gov.” http://energy.gov/.
U.S. Department of Health & Human Services. “Agency for Healthcare Research and Quality.” http://www.ahrq.gov/.
United States Department of Agriculture. “USDA.” http://www.usda.gov/wps/portal/usda/usdahome.
Schneider, Friedrich. Department of Economics. “Size and Development of the Shadow Economy of 31 European and 5 other OECD Countries from 2003 to 2013: A Further Decline.” Johannes Kepler University. Last modified April 5, 2013. http://www.econ.jku.at/members/Schneider/files/publications/2013/ShadEcEurope31_Jan2013.pdf.
Glossary
- depreciation
- the process by which capital ages over time and therefore loses its value
- double counting
- a potential mistake to be avoided in measuring GDP, in which output is counted more than once as it travels through the stages of production
- durable good
- long-lasting good like a car or a refrigerator
- final good and service
- output used directly for consumption, investment, government, and trade purposes; contrast with “intermediate good”
- gross domestic product (GDP)
- the value of the output of all goods and services produced within a country in a year
- gross national product (GNP)
- includes what is produced domestically and what is produced by domestic labor and business abroad in a year
- intermediate good
- output provided to other businesses at an intermediate stage of production, not for final users; contrast with “final good and service”
- inventory
- good that has been produced, but not yet been sold
- national income
- includes all income earned: wages, profits, rent, and profit income
- net national product (NNP)
- GDP minus depreciation
- nondurable good
- short-lived good like food and clothing
- service
- product which is intangible (in contrast to goods) such as entertainment, healthcare, or education
- structure
- building used as residence, factory, office building, retail store, or for other purposes
- trade balance
- gap between exports and imports
- trade deficit
- exists when a nation’s imports exceed its exports and is calculated as imports –exports
- trade surplus
- exists when a nation’s exports exceed its imports and is calculated as exports – imports
Solutions
Answers to Self-Check Questions
- GDP is C + I + G + (X – M). GDP = $2,000 billion + $50 billion + $1,000 billion + ($20 billion – $40 billion) = $3,030
- Hospital stays are part of GDP.
- Changes in life expectancy are not market transactions and not part of GDP.
- Child care that is paid for is part of GDP.
- If Grandma gets paid and reports this as income, it is part of GDP, otherwise not.
- A used car is not produced this year, so it is not part of GDP.
- A new car is part of GDP.
- Variety does not count in GDP, where the cheese could all be cheddar.
- The iron is not counted because it is an intermediate good.
